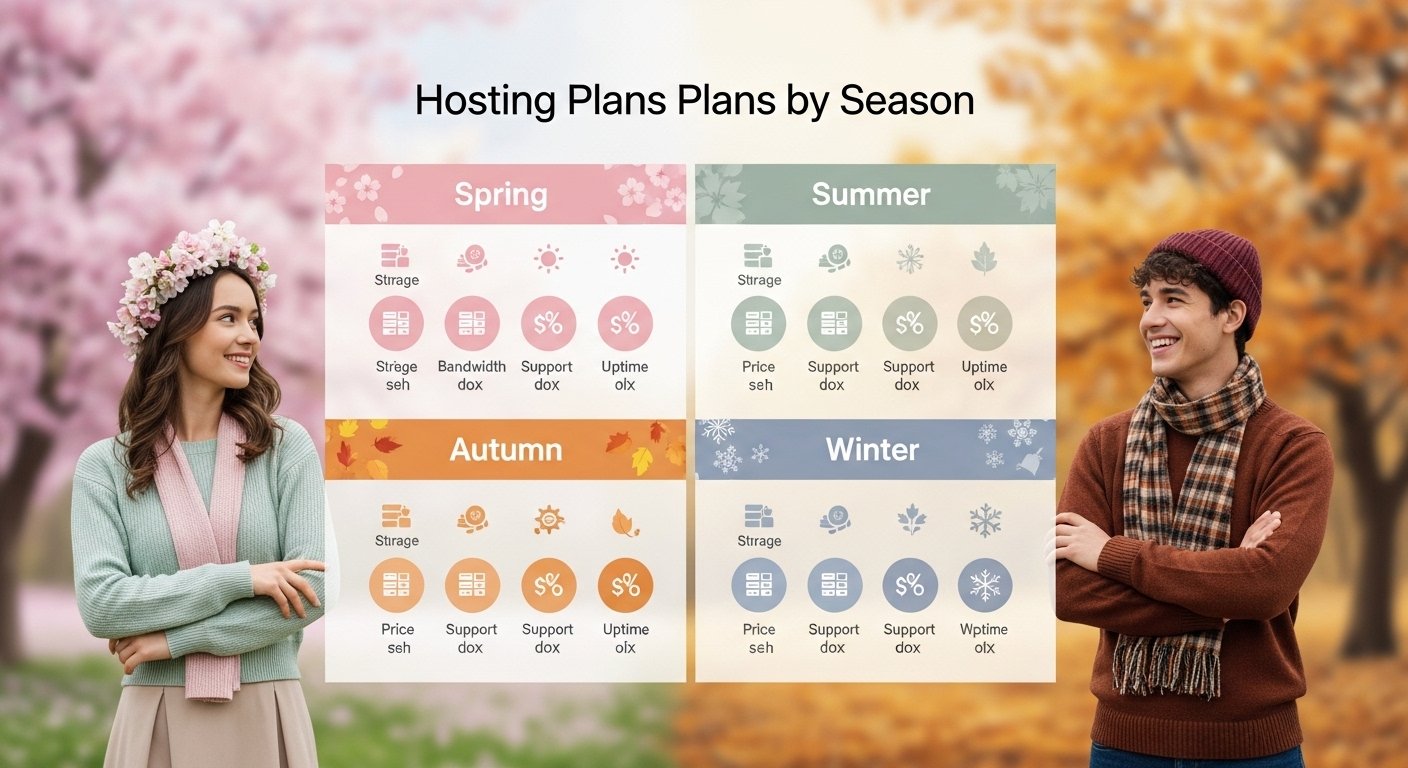
📊 Visual Content: Infographic – Hosting Plan Comparison by Season
See the Shift. Scale with Certainty.
Sometimes, a picture really is worth a thousand words. While this article is text‑based, the concept of a seasonal hosting strategy lends itself perfectly to visual storytelling. In this section, we’ll describe the key elements of a custom infographic that compares hosting needs across the calendar—showing exactly when to rely on Hostinger Hosting and when to upgrade to a premium platform.
Think of this as your visual roadmap for the year. Use it to plan migrations, budget hosting costs, and ensure your site is always running on the right infrastructure.
🗺️ Infographic Overview: A Year in Seasonal Hosting
The infographic is divided into three main sections:
- The 12‑Month Calendar View – Visualizing traffic patterns and hosting choices by season.
- The Two‑Tier Stack – A side‑by‑side comparison of Hostinger Hosting vs. a premium platform.
- The ROI at a Glance – Cost savings and performance gains illustrated with simple icons.
Below, we break down each section in detail so you can understand—and recreate—the visual strategy.
📅 1. The 12‑Month Calendar View
This part of the infographic uses a horizontal timeline, with months color‑coded to indicate hosting status.
| Month | Traffic Level | Hosting Choice | Color | Key Events |
|---|
| January | Low | Hostinger Hosting | 🟢 Green | Post‑holiday slowdown |
| February | Low | Hostinger Hosting | 🟢 Green | – |
| March | Low–Medium | Hostinger Hosting | 🟢 Green | Spring planning |
| April | Medium | Hostinger Hosting | 🟢 Green | Tax season (US) |
| May | Medium | Hostinger Hosting | 🟢 Green | Summer prep |
| June | Medium–High | Hostinger Hosting | 🟢 Green | Summer sales (EU) |
| July | Medium–High | Hostinger Hosting | 🟢 Green | Summer peak |
| August | Medium | Hostinger Hosting | 🟢 Green | Back‑to‑school |
| September | Medium–High | Hostinger Hosting | 🟢 Green | Pre‑holiday ramp‑up |
| October | High | Switch to Premium | 🔵 Blue | Pre‑Black Friday preparation |
| November | Very High | Premium Platform | 🔴 Red | Black Friday, 11.11 Singles’ Day |
| December | Very High | Premium Platform | 🔴 Red | Cyber Monday, Boxing Day, Christmas |
Visual cues:
- A green segment represents the months where Hostinger Hosting is the ideal choice—cost‑effective, reliable, and fast enough for steady traffic.
- A blue arrow in October indicates the migration window.
- Red segments for November–December show peak season when a premium platform takes over.
Below the timeline, icons mark major regional events:
- 🇺🇸 Black Friday (November)
- 🌏 11.11 Singles’ Day (November)
- 🇬🇧 Boxing Day (December)
- 🇦🇺 Boxing Day & Summer Holidays (December–February)
- 🇪🇺 Summer Sales (June–August)
Hostinger 2026 — Fast. Global. Reliable. Starts Here
🧩 2. The Two‑Tier Stack: Side‑by‑Side Comparison
This section of the infographic uses a split‑panel design to contrast the two hosting choices across key categories.
🟢 Left Panel: Hostinger Hosting (10–11 Months)
| Attribute | Description |
|---|
| Best For | Steady, predictable traffic |
| Price | $2.99–$9.99/month (up to 88% off) |
| Infrastructure | LiteSpeed servers, global data centers, free CDN |
| Scalability | Easy upgrades within Hostinger ecosystem (Cloud, VPS) |
| Support | 24/7 live chat |
| Key Features | Free SSL, daily backups, AI tools, WordPress optimized |
| Ideal Regions | USA, UK, Europe, Asia, Australia (choose nearest data center) |
🔴 Right Panel: Premium Platform (1–2 Months)
| Attribute | Description |
|---|
| Best For | High‑concurrency spikes, mission‑critical uptime |
| Price | $35–$100+/month (short‑term commitment) |
| Infrastructure | Google Cloud premium tier or equivalent; auto‑scaling containers |
| Scalability | Automatic resource scaling; no manual intervention |
| Support | Priority 24/7 support, often with dedicated account managers |
| Key Features | Built‑in edge caching, enterprise CDN, staging, backups |
| Ideal Regions | Global with edge caching; optimized for peak regional events |
Visual takeaway:
The two panels are connected by a double‑headed arrow labeled “Seasonal Switch,” emphasizing that you move between them, not choose one permanently.
💰 3. The ROI at a Glance
This section uses simple icons and numbers to illustrate the financial and performance benefits of a seasonal strategy.
Cost Savings
| Approach | Annual Cost Estimate | Performance |
|---|
| Stay on Premium All Year | $420–$1,200+ | Excellent, but over‑powered for 10 months |
| Stay on Budget All Year | $36–$120 | Risk of crashes during spikes |
| Seasonal Strategy | ~$190 | Optimized: low cost + peak performance |
Visual: A bar chart showing the seasonal strategy bar at a medium height, with a “✅ Best Value” callout.
Performance Gains
- Uptime: 99.9% (Hostinger) → 99.99% (premium)
- Page Load Time: <2 seconds steady → <2 seconds even under 10x traffic
- Conversion Protection: Avoids the 7–15% drop typically caused by slowdowns
Visual: Icons for speed, uptime, and revenue with upward arrows.
Peace of Mind
- No more 3 AM site checks
- Confidence to run aggressive campaigns
- Focus on content and conversions, not server limits
Visual: A simple “😌” icon with the caption “Sleep well. Your site is covered. “
Hostinger 2026 — Fast. Global. Reliable. Starts Here
🖼️ How to Use This Infographic
- Pin it to your wall as a seasonal planning calendar.
- Share it with your team (or your future self) to remember migration windows.
- Use it in your own content (if you’re a creator) to explain seasonal hosting to your audience.
If you’re a visual learner, this infographic distills the entire seasonal hosting strategy into one glanceable reference. And if you’re ready to implement, the steps and checklists earlier in this guide will walk you through the details.
✅ Key Takeaways from the Visual
- ✅ Hostinger Hosting is the go‑to choice for 10–11 months of the year, offering exceptional value and solid performance.
- ✅ Premium platforms are essential for the 1–2 months of peak events, providing auto‑scaling, enterprise reliability, and peace of mind.
- ✅ The seasonal switch is visually simple—migrate in October, return in January.
- ✅ Regional events (Black Friday, 11.11, Boxing Day, summer sales) dictate when and where you need peak performance.
- ✅ The ROI is clear: lower annual costs, higher uptime, and protected revenue.