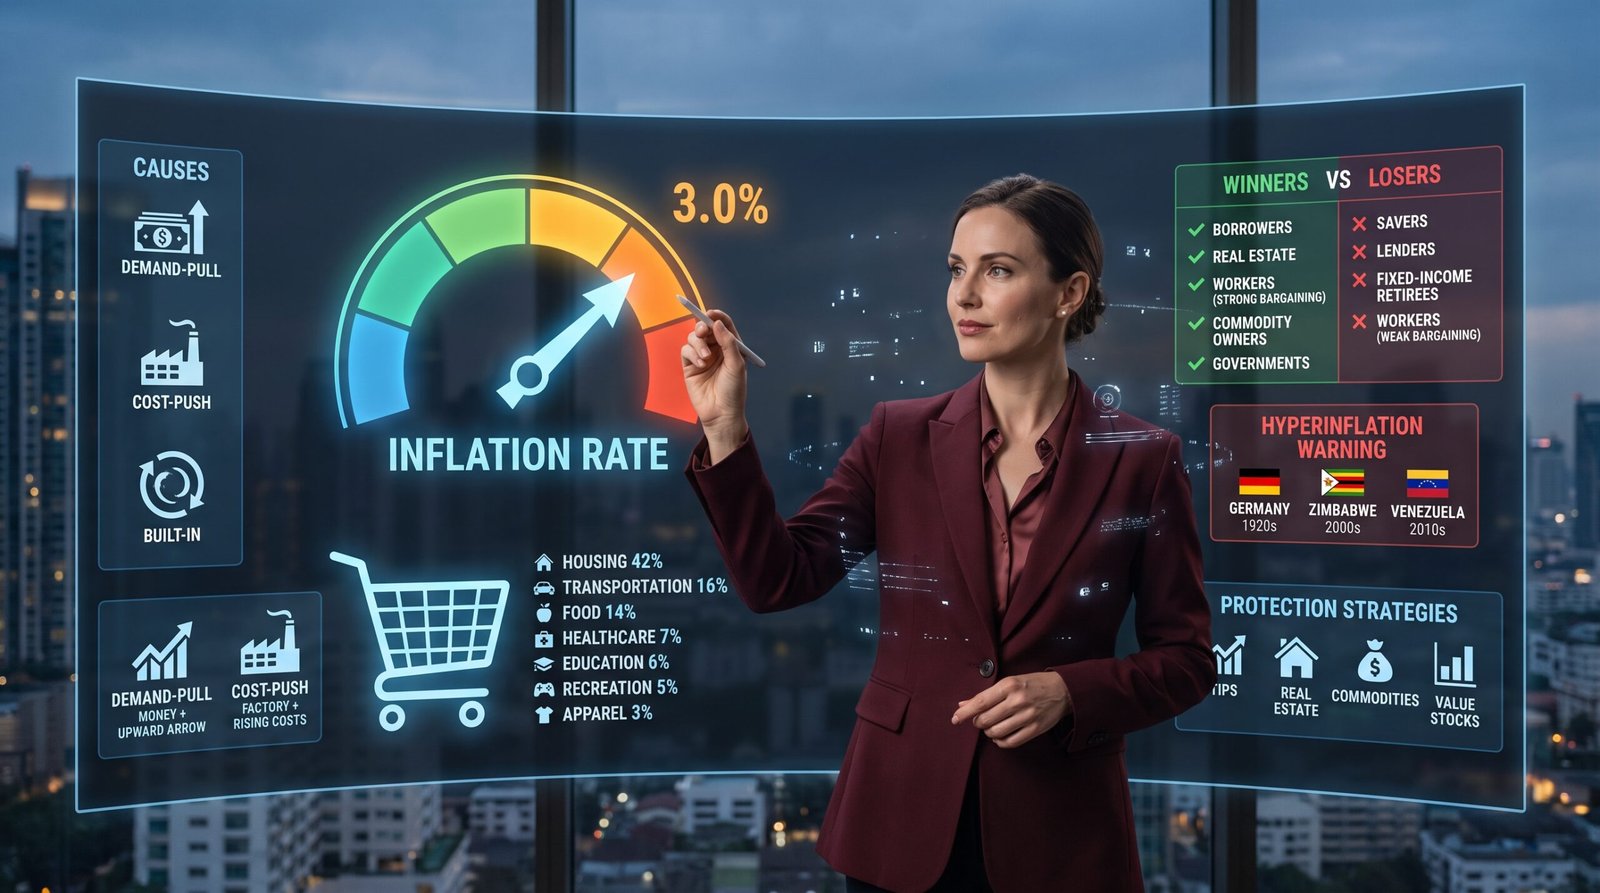
How Rising Prices Impact the Domestic and Global Economy
Prices. Rise. Impact. 📈
When understanding the economy, few metrics create as much anxiety as the inflation rate. It’s the silent thief that slowly (or sometimes rapidly) erodes the value of your hard-earned money. Whether you are in the United States 🇺🇸, United Kingdom 🇬🇧, Europe 🇪🇺, Asia 🌏, Australia 🇦🇺, or anywhere else globally 🌐, inflation affects what you can buy with your paycheck, how much your savings are worth, and whether you can afford a home, a car, or even groceries.
In this segment, we dive deep into the inflation rate—what it measures, how it’s calculated, the different types of inflation, what the numbers mean for the domestic and global economy, and why it matters for your money.
👉 Protect your purchasing power from inflation. [Discover inflation-protected investment tools here] 🛡️
What Is the Inflation Rate? (Definition)
The Simple Definition
The inflation rate measures the rate at which the general level of prices for goods and services is rising, reducing the purchasing power of money over time.
Simple Definition: How fast your money is losing value. 💸
What Inflation Means for Your Wallet
| If You Have | And Inflation Is… | Then… |
|---|
| $100 in cash | 2% (normal) | One year from now, that $100 buys what $98 buys today. |
| $100 in cash | 5% (elevated) | One year from now, that $100 buys what $95 buys today. |
| $100 in cash | 10% (high) | One year from now, that $100 buys what $90 buys today. |
Key Terminology
| Term | Definition | Example |
|---|
| Inflation | Rising prices; falling purchasing power. | A loaf of bread costs $3 today, $3.15 next year. |
| Deflation | Falling prices; rising purchasing power. | A loaf of bread costs $3 today, $2.85 next year. |
| Disinflation | Slowing inflation (prices still rise, but more slowly). | Inflation falls from 6% to 3%. |
| Hyperinflation | Extremely rapid inflation (often 50%+ per month). | Germany (1920s), Zimbabwe (2000s), Venezuela (2010s). |
Examples:
📍 Domestic Economy Example: In the United States, inflation reached 9.1% in June 2022—the highest in 40 years. A basket of groceries that cost $100 in 2021 cost over $109 by mid-2022. Gasoline, rent, and used cars all saw double-digit percentage increases.
📍 Global Example: In Europe (UK, Germany, France) , inflation also spiked after the Russian invasion of Ukraine, which cut natural gas supplies and sent energy prices soaring. Households faced heating bills that doubled or tripled, and factories reduced production due to high energy costs.
👉 Track inflation in real-time. [Get real-time economic data and inflation tools here] 📊
How Inflation Is Measured (CPI, PPI, Core Inflation, GDP Deflator)
The Main Inflation Measures
| Measure | Definition | What It Includes | Who Uses It |
|---|
| Consumer Price Index (CPI) | Measures price changes of a typical basket of household goods and services. | Food, housing, clothing, transportation, healthcare, education, entertainment. | Most common measure; used for Social Security COLAs. |
| Core Inflation (Core CPI) | CPI excluding volatile food and energy prices. | Same as CPI minus food and energy. | Central banks (shows underlying trend). |
| Producer Price Index (PPI) | Measures inflation at the wholesale level (before goods reach consumers). | Raw materials, intermediate goods, finished goods leaving factories. | Businesses; leading indicator of future consumer inflation. |
| GDP Deflator | Measures inflation across all sectors of the economy. | Everything included in GDP (consumption, investment, government, net exports). | Economists; broader than CPI. |
The Consumer Price Index (CPI) Basket
The CPI basket represents what a typical household buys. The weights change over time to reflect actual spending patterns.
| Category | Approximate Weight (US) | Examples |
|---|
| Housing | 40-45% | Rent, mortgage interest, utilities, furniture. |
| Transportation | 15-18% | New and used cars, gasoline, public transit, airfare. |
| Food | 13-15% | Groceries (at-home) and restaurant meals (away-from-home). |
| Healthcare | 7-8% | Health insurance, prescription drugs, doctor visits, hospital services. |
| Education & Communication | 5-7% | Tuition, childcare, postage, phone plans, internet. |
| Recreation | 5-6% | Sporting events, toys, pets, hobbies, TVs. |
| Apparel | 2-3% | Clothing, shoes, accessories. |
| Other | 2-3% | Alcohol, tobacco, personal care. |
Examples:
📍Domestic Economy Example: In the United States, shelter (housing) is the largest component of CPI, accounting for over 40% of the index. When rent and home prices rise, inflation is heavily affected—which is exactly what happened in 2022-2023 as housing costs surged.
📍 Global Example: In Europe (Germany, France, Italy) , food and energy have higher weights in their inflation baskets than in the US because European households spend a larger share of income on these necessities. This made European inflation more sensitive to the 2022 energy price shock.
CPI vs. Core Inflation: Why Both Matter
| Metric | 2022 Peak (US Example) | What It Tells You |
|---|
| CPI (Headline) | 9.1% | Total inflation including volatile food and energy. |
| Core CPI | 6.6% | Underlying inflation trend (excluding food and energy). |
Why the difference? Food and energy prices are volatile—they can spike due to weather (crop failures), war (oil prices), or supply chain issues. Core inflation gives a cleaner picture of whether inflation is “baked into” the economy through wages, rents, and expectations.
👉 Understand both headline and core inflation. [Get comprehensive inflation tracking tools here] 📈
The Three Causes of Inflation (Demand-Pull, Cost-Push, Built-In)
Understanding the economy requires knowing why inflation happens. Economists identify three primary causes.
Cause #1: Demand-Pull Inflation (Too Much Money Chasing Too Few Goods)
| Aspect | Explanation |
|---|
| Definition | Inflation caused by an increase in aggregate demand (spending) that outpaces the economy’s ability to produce. |
| Phrase | “Too much money chasing too few goods.” |
| Causes | Stimulus checks, low interest rates, tax cuts, strong consumer confidence, government spending. |
| Example | Post-COVID: Stimulus checks + pent-up savings + low interest rates → surge in spending → supply couldn’t keep up → prices rose. |
Cause #2: Cost-Push Inflation (Rising Production Costs Passed to Consumers)
| Aspect | Explanation |
|---|
| Definition | Inflation caused by an increase in the cost of production inputs (raw materials, labor, energy). |
| Phrase | “Higher costs mean higher prices.” |
| Causes | Rising oil prices, higher wages, supply chain disruptions, tariffs, natural disasters. |
| Example | 1970s oil shocks: OPEC cut oil supply → energy prices soared → shipping costs rose → everything cost more. |
Cause #3: Built-In Inflation (The Wage-Price Spiral)
| Aspect | Explanation |
|---|
| Definition | Inflation caused by expectations of future inflation, leading to a self-fulfilling cycle. |
| Phrase | “Workers demand higher wages because prices are rising, which forces prices higher.” |
| Causes | High inflation expectations; strong unions; cost-of-living adjustments (COLAs). |
| Example | Workers expect 5% inflation → demand 5% raise → employers raise prices to cover higher labor costs → inflation becomes 5% → cycle repeats. |
The Three Causes Visualized
┌─────────────────────────────────────────────────────────────────────────────┐
│                         THE THREE CAUSES OF INFLATION                        │
├─────────────────────────────────────────────────────────────────────────────┤
│                                                                             │
│  1. DEMAND-PULL                   2. COST-PUSH               3. BUILT-IN    │
│                                                                             │
│  Too much money                    Rising production          Wage-price    │
│  chasing too few goods             costs passed to            spiral of     │
│                                    consumers                  expectations  │
│                                                                             │
│  Example:                          Example:                   Example:      │
│  Stimulus checks +                 Oil price spike →          Inflation at  │
│  low rates →                       higher shipping →          5% → workers  │
│  spending surge                    higher store prices        demand 5%     │
│                                                                             │
└─────────────────────────────────────────────────────────────────────────────┘
Examples:
📍Domestic Economy Example: The United States experienced demand-pull inflation in 2021-2022 (stimulus checks, low rates, pent-up demand) combined with cost-push inflation (supply chain disruptions, energy price spikes). The combination created the highest inflation in 40 years.
📍 Global Example: Europe experienced severe cost-push inflation after Russia invaded Ukraine. Natural gas prices skyrocketed, raising electricity bills, factory costs, and fertilizer prices (which raised food costs). This was primarily a supply-side shock.
👉 Understand what’s driving today’s inflation. [Get economic analysis and forecasting tools here] 🔍
What the Inflation Rate Tells You About the Economy
Inflation Rate Categories and Economic Signals
| Inflation Rate | Economic Condition | What It Means for the Domestic and Global Economy |
|---|
| Below 0% (Deflation) | Prices falling; dangerous for economy. | Consumers delay purchases (wait for lower prices); falling wages; debt becomes heavier (repaying with more valuable dollars). |
| 0-2% (Very low) | Economy may be too cold; risk of deflation. | Low price increases; but risk of economic stagnation; central banks may cut rates. |
| 2-3% (Moderate/Target) | Healthy, normal inflation (central bank target). | Stable prices; moderate wage growth; economy growing sustainably. |
| 3-6% (Elevated) | Economy overheating. | Prices rising faster than wages; purchasing power eroding; central banks raise rates. |
| Above 6% (High inflation) | Economy in crisis. | Rapid loss of purchasing power; savings devastated; social unrest risk. |
| Above 50% per month (Hyperinflation) | Economic collapse. | Money becomes worthless; barter economy emerges; political collapse. |
The Optimal Inflation Rate: Why 2%?
| Reason | Explanation |
|---|
| Deflation buffer | 2% inflation gives central banks room to cut rates during recessions without falling into deflation. |
| Wage flexibility | Mild inflation makes it easier to adjust real wages (some wages rise, some stay flat). |
| Avoids deflation spiral | Deflation leads to delayed purchases, falling demand, falling production, falling wages, more deflation. |
| Internationally accepted | Most major central banks target 2% (Fed, ECB, Bank of England, Bank of Japan, RBA). |
Examples:
📍Domestic Economy Example: The United States Federal Reserve targets 2% annual inflation. When inflation exceeded 9% in 2022, the Fed raised interest rates aggressively to bring it back down—even at the risk of causing a recession.
📍 Global Example: In Europe (UK, Germany, France) , the European Central Bank (ECB) also targets 2% inflation. When the eurozone experienced double-digit inflation in 2022-2023, the ECB raised rates for the first time in over a decade.
👉 Position your portfolio for the inflation environment. [Discover inflation-ready investment tools here] 📊
Winners and Losers from Inflation
Not everyone loses from inflation. Understanding the economy means knowing who benefits and who suffers.
Winners ✅
| Winner | Why They Win | Example |
|---|
| Borrowers (fixed-rate debt) | Repay loans with money that’s worth less than when they borrowed. | A homeowner with a 3% fixed mortgage wins when inflation is 6% (real interest rate is -3%). |
| Real estate owners | Property values and rents rise with inflation. | A landlord’s rental income increases; property value appreciates. |
| Workers with strong bargaining power | Wages keep pace with or exceed inflation. | Unionized workers with cost-of-living adjustments (COLAs). |
| Commodity owners | Gold, oil, copper, agricultural prices rise with inflation. | Gold investors during 1970s inflation or 2022 inflation. |
| Governments (with fixed-rate debt) | Inflate away the real value of their debt. | US government benefits from moderate inflation (reduces debt burden). |
Losers ❌
| Loser | Why They Lose | Example |
|---|
| Savers (cash, low-interest accounts) | The real value of savings erodes. | A savings account earning 0.5% while inflation is 6% loses 5.5% purchasing power per year. |
| Lenders (fixed-rate) | Get repaid with money worth less than when they lent. | A bond investor earning 2% interest when inflation is 6% has a real return of -4%. |
| Fixed-income retirees | Pensions and Social Security may not keep pace. | A retiree on a fixed pension sees their living standards fall as prices rise. |
| Workers with weak bargaining power | Wages lag behind inflation. | Minimum wage workers when the minimum wage is not indexed to inflation. |
| Cash-heavy businesses | Cash on hand loses value; customers reduce spending. | A restaurant with cash reserves; a retailer facing price-sensitive customers. |
Real vs. Nominal Returns: The Inflation Tax
| Term | Formula | Example |
|---|
| Nominal Return | The stated return (not adjusted for inflation). | A savings account pays 2% interest. |
| Real Return | Nominal Return – Inflation Rate | 2% – 6% = -4% real return (you’re losing purchasing power). |
The ‘Inflation Tax”: Even if you pay no income tax, inflation stealthily taxes your savings by reducing their purchasing power.
Examples:
📍Domestic Economy Example: In the United States during 2022, savers with money in standard bank accounts (earning 0.1-0.5%) faced massive negative real returns. A saver with $10,000 earned maybe $50 in interest but lost $900 in purchasing power (9% inflation). That’s an $850 loss.
📍 Global Example: In Europe (Germany, UK, France) , bond investors experienced the same phenomenon. A German Bund (government bond) yielding 1% when inflation was 8% produced a -7% real return—one of the worst periods for bond investors in history.
👉 Protect your savings from the inflation tax. [Explore high-yield savings and inflation-protected securities here] 🛡️
Hyperinflation (When Inflation Goes Crazy)
What Is Hyperinflation?
Hyperinflation is extremely rapid, out-of-control inflation, often exceeding 50% per month. Prices double every few weeks or even days. Money becomes nearly worthless.
Famous Hyperinflation Episodes
| Country | Period | Peak Monthly Inflation | Impact |
|---|
| Germany | 1921-1924 | 29,500% (prices doubled every 3-4 days) | Wheelbarrows of cash for bread; barter economy; political extremism (rise of Nazis). |
| Zimbabwe | 2007-2009 | 79.6 billion % (prices doubled every 24 hours) | $100 trillion banknotes; unemployment 80%; economic collapse. |
| Venezuela | 2016-2019 | 34,000% (prices doubled every 2-3 weeks) | Millions fled; widespread hunger; healthcare collapse. |
| Yugoslavia | 1992-1994 | 313 million % | UN sanctions + war → economic collapse; barter economy. |
What Causes Hyperinflation?
| Cause | Explanation |
|---|
| Excessive money printing | Government prints money to pay debts (instead of raising taxes). |
| Loss of confidence | People stop trusting the currency; spend it as fast as they get it (velocity rises). |
| Political/economic collapse | War, sanctions, or government collapse destroys production while money printing continues. |
Examples:
📍 Domestic Economy Example: The United States has never experienced hyperinflation. The closest was during the Revolutionary War (Continental Currency) and Civil War (Greenbacks), but neither reached true hyperinflation levels.
📍 Global Example: Venezuela was once one of the wealthiest countries in South America (oil wealth). Political mismanagement, corruption, and price controls led to hyperinflation. Millions of Venezuelans fled to Colombia, Peru, and the US.
👉 Protect yourself from currency collapse. [Explore global diversification and hard asset investment tools here] 🌍
Deflation (The Opposite of Inflation)
What Is Deflation?
Deflation is a decrease in the general price level of goods and services. While falling prices sound good for consumers, deflation is actually very dangerous for the economy.
Simple Definition: Prices are falling; your money is gaining value. But be careful what you wish for. ❄️
Why Deflation Is Dangerous
| Effect | Explanation |
|---|
| Delayed purchases | Why buy today if it will be cheaper tomorrow? Consumers stop spending. |
| Falling demand | Delayed spending → falling demand → falling production → layoffs. |
| Falling wages | Businesses cut wages to survive → workers have less to spend. |
| Heavier debt burden | You repay loans with money that is worth more than when you borrowed. |
| Deflation spiral | Falling prices → delayed purchases → falling demand → falling production → falling wages → more falling prices. |
Famous Deflationary Episodes
| Episode | Time Period | Impact |
|---|
| Great Depression | 1929-1933 (US) | Prices fell 25%; unemployment 25%; banks failed; GDP fell 30%. |
| Japan’s Lost Decades | 1990s-2010s (Japan) | Persistent mild deflation; stagnant growth; falling wages; demographic decline. |
Examples:
📍 Domestic Economy Example: During the United States Great Depression (1929-1933), deflation was severe—prices fell by 25%. People delayed purchases, banks failed, and unemployment hit 25%. The Federal Reserve’s failure to prevent deflation made the depression worse.
📍 Global Example: Japan has experienced on-and-off deflation since the 1990s. The Bank of Japan has fought deflation for decades with near-zero interest rates and massive money printing—with limited success. Deflation contributed to Japan’s “Lost Decades” of stagnation.
👉 Protect against both inflation and deflation. [Discover balanced portfolio and asset allocation tools here] ⚖️
How Central Banks Control Inflation
The Primary Tool: Interest Rates
| Action | How It Works | Effect on Inflation |
|---|
| Raise interest rates | Borrowing becomes more expensive → spending slows → demand falls → inflation cools. | ✅ Lowers inflation |
| Lower interest rates | Borrowing becomes cheaper → spending increases → demand rises → inflation rises. | ⚠️ Raises inflation (used during recessions) |
Other Tools
| Tool | How It Works | Who Uses It |
|---|
| Open Market Operations | Central bank buys or sells government bonds to increase/decrease money supply. | All major central banks. |
| Reserve Requirements | How much banks must hold in reserve (higher requirements = less lending = less inflation). | Central banks (less common now). |
| Forward Guidance | Central bank communicates future policy intentions to shape expectations. | All major central banks (Fed, ECB, BoE, BoJ, RBA). |
| Quantitative Tightening (QT) | Reducing the money supply by selling bonds or letting them mature. | Fed, ECB, BoE (post-COVID). |
Examples:
📍Domestic Economy Example: The United States Federal Reserve raised interest rates 11 times between 2022 and 2023 (from near 0% to over 5%) to fight 9% inflation. As of 2024-2025, inflation has fallen back toward 2-3%, demonstrating the effectiveness of rate hikes.
📍 Global Example: In Europe (UK, Germany, France) , the European Central Bank (ECB) was slower to raise rates but eventually followed the Fed. The Bank of England also raised rates aggressively, even as the UK economy struggled with Brexit-related trade frictions.
👉 Follow central bank actions. [Get real-time central bank policy tracking tools here] 🏦
Summary: Inflation Rate
| Sub-Section | Key Takeaway |
|---|
| 3.5.1 What Is the Inflation Rate? | Rate at which prices rise; purchasing power falls. |
| 3.5.2 How It’s Measured | CPI (headline), Core CPI (ex-food/energy), PPI (wholesale), GDP Deflator (broad). |
| 3.5.3 Three Causes | Demand-pull (too much spending), Cost-push (higher costs), Built-in (wage-price spiral). |
| 3.5.4 What It Tells You | 2-3% = healthy; above 6% = crisis; below 0% (deflation) = dangerous. |
| 3.5.5 Winners & Losers | Winners: borrowers, real estate, commodity owners. Losers: savers, lenders, fixed-income retirees. |
| 3.5.6 Hyperinflation | Out-of-control inflation (>50%/month); money becomes worthless. |
| 3.5.7 Deflation | Falling prices; dangerous for economy (delayed purchases, heavier debts). |
| 3.5.8 Central Bank Control | Raise rates to cool inflation; lower rates to stimulate growth. |
🌟Final Thoughts on the Inflation Rate
Understanding the economy requires mastering the inflation rate—its causes, its measurement, and its impact.
| Do This | Don’t Do This |
|---|
| ✅ Watch both headline CPI and core inflation. | ❌ Ignore inflation when making long-term savings and investment decisions. |
| ✅ Understand the difference between nominal and real returns. | ❌ Keep large amounts of cash in low-interest accounts during high inflation. |
| ✅ Diversify with inflation hedges (real estate, TIPS, commodities). | ❌ Panic during moderate inflation (2-3% is normal and healthy). |
| ✅ Follow central bank policy (rate decisions affect your finances). | ❌ Assume hyperinflation is coming (extremely rare in developed economies). |
Inflation is not always the enemy. Moderate, predictable inflation (2-3%) is a sign of a healthy, growing domestic and global economy. But high, unpredictable inflation destroys purchasing power, devastates savings, and creates economic chaos. By mastering the inflation rate, you can protect your wealth, make smarter investment decisions, and navigate the economic cycle with confidence.
👉 Take control of your financial future. [Start your journey with comprehensive financial planning tools here] 🚀
❓ Frequently Asked Questions (FAQs) – Inflation Rate