
Resource and Economy Tools Posts Menu
Understanding the Economy: 7 Powerful Ways the Domestic and Global Economy Shapes Your Money in 2026
yelli
June 3, 2026
4:24 am
Budget Deficit / Surplus – The Government’s Checkbook 📋💰⚖️
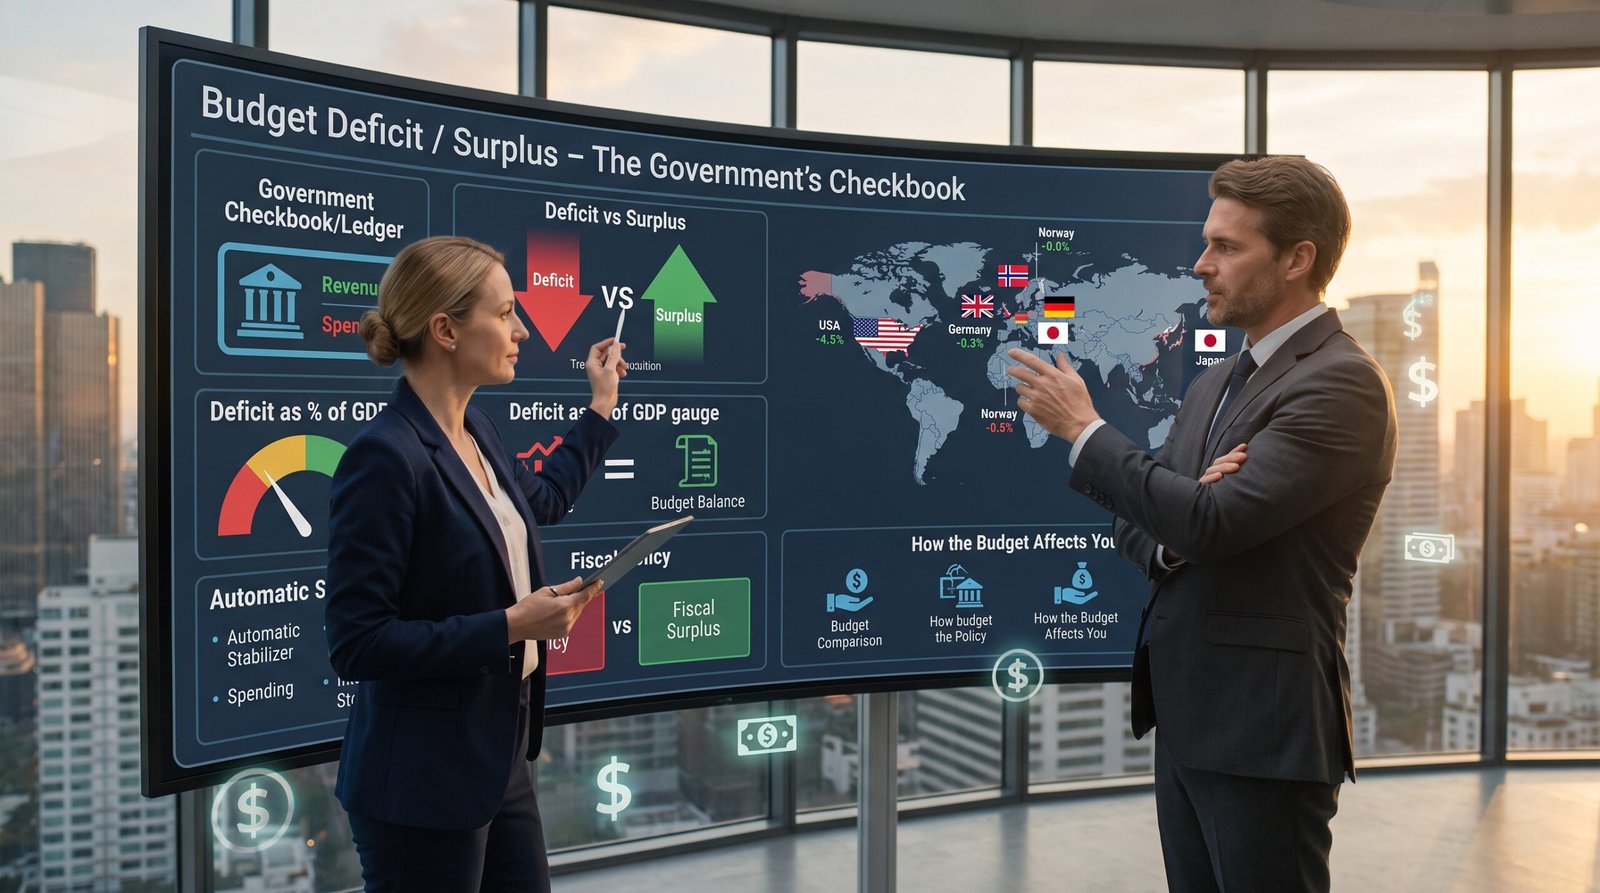
How Fiscal Health Shapes the Domestic and Global Economy
Spend. Tax. Balance. 📊
When understanding the economy, the government’s budget deficit or surplus reveals whether the state is spending beyond its means (deficit) or living within them (surplus). Whether you are in the United States 🇺🇸, United Kingdom 🇬🇧, Europe 🇪🇺, Asia 🌏, Australia 🇦🇺, or anywhere else globally 🌐, budget deficits affect your taxes, your interest rates, your government services, and even the long-term health of the domestic and global economy.
In this Segment, we dive deep into the budget deficit and surplus—what they are, how they’re measured, what the numbers mean for the domestic and global economy, the trade-offs between deficits and surpluses, and why they matter for your money.
👉 Track government fiscal policy. [Get economic data and analysis tools here] 📊
What Is a Budget Deficit and Surplus? (Definition)
The Simple Definitions
| Term | Definition | Formula |
|---|---|---|
| Budget Deficit | When government spending exceeds government revenue (taxes and other income) in a given year. | Spending – Revenue = POSITIVE number (+) |
| Budget Surplus | When government revenue exceeds government spending in a given year. | Revenue – Spending = POSITIVE number (+) |
| Balanced Budget | When government spending equals government revenue. | Spending = Revenue |
Simple Definition: Deficit = spending more than you take in (like using a credit card). Surplus = spending less than you take in (saving money). 💳
The Flow vs. Stock Relationship (Critical Distinction)
| Concept | Definition | Analogy |
|---|---|---|
| Budget Deficit (Flow) | The annual shortfall (how much the government borrows each year). | How much you add to your credit card balance each month. |
| Public Debt (Stock) | The accumulated total of all past deficits (minus surpluses). | Your total credit card balance. |
┌─────────────────────────────────────────────────────────────────────────────┐
│                    DEFICIT FLOW → DEBT STOCK                                │
├─────────────────────────────────────────────────────────────────────────────┤
│                                                                             │
│   Year 1: Deficit = $1 trillion  ──► Debt increases by $1 trillion         │
│   Year 2: Deficit = $1 trillion  ──► Debt increases by another $1 trillion │
│   Year 3: Surplus = $0.5 trillion ──► Debt decreases by $0.5 trillion      │
│                                                                             │
│   After 3 years: Total Debt = Starting Debt + $1.5 trillion                │
│                                                                             │
└─────────────────────────────────────────────────────────────────────────────┘
Examples:
📍 Domestic Economy Example: In the United States, the federal government runs a budget deficit in most years (spending > revenue). Each year’s deficit adds to the total national debt (which now exceeds $34 trillion). The last time the US ran a significant surplus was 1998-2001 (under President Clinton).
📍 Global Example: In Germany, the government has run budget surpluses in some recent years (before COVID-19), allowing it to reduce its debt-to-GDP ratio. Germany’s constitutional “debt brake” limits structural deficits, reflecting a cultural fear of inflation (hyperinflation in 1920s).
👉 Understand the deficit-debt connection. [Get fiscal policy and debt tracking tools here] 📈
How Budget Deficits and Surpluses Are Calculated
The Government Budget Formula
Budget Balance = Total Revenue – Total Spending
| Component | Definition | Examples |
|---|---|---|
| Total Revenue | Money the government collects from taxes and other sources. | Individual income taxes, corporate income taxes, payroll taxes (Social Security, Medicare), tariffs, excise taxes (gas, alcohol, tobacco), fees. |
| Total Spending | Money the government spends on programs, services, and interest. | Mandatory spending (Social Security, Medicare, Medicaid, veterans benefits); Discretionary spending (defense, education, infrastructure, science); Net interest (interest paid on national debt). |
If Budget Balance Is…
| Result | Sign | What It Means | What Happens to Debt |
|---|---|---|---|
| Deficit | Negative (-) | Spending > Revenue | Debt INCREASES |
| Surplus | Positive (+) | Revenue > Spending | Debt DECREASES |
| Balanced | Zero (0) | Revenue = Spending | Debt UNCHANGED |
The US Federal Budget (Illustrative Example)
| Category | Amount (Trillions USD) | % of Total |
|---|---|---|
| Total Revenue | $4.5 – $5.0 | 100% |
| — Individual income taxes | $2.5 – $3.0 | 55-60% |
| — Payroll taxes (Social Security, Medicare) | $1.5 – $1.7 | 30-35% |
| — Corporate income taxes | $0.4 – $0.5 | 8-10% |
| — Other (tariffs, excise taxes, fees) | $0.2 – $0.3 | 5% |
| Total Spending | $6.0 – $6.5 | 100% |
| — Mandatory spending (Social Security, Medicare, Medicaid, etc.) | $3.5 – $4.0 | 60-65% |
| — Discretionary spending (defense, non-defense) | $1.5 – $1.7 | 25-30% |
| — Net interest (on national debt) | $0.8 – $1.0 | 10-15% |
| Budget Deficit | -$1.5 to -$2.0 | Deficit |
Examples:
📍 Domestic Economy Example: The United States budget deficit in recent years (2020-2025) has ranged from $1.5 trillion to $3 trillion annually (peaking during COVID-19 stimulus). Deficit as a percentage of GDP ranged from 5-15% (peaking during pandemic). Pre-COVID, deficits were around 3-5% of GDP.
📍 Global Example: In Europe (Germany, France, Italy, UK) , budget deficits are constrained by EU fiscal rules (Maastricht Treaty: deficit <3% of GDP, debt <60% of GDP). Many countries violate these rules, especially after COVID-19 and the energy crisis, leading to tensions between northern (fiscally conservative) and southern (high-debt) members.
👉 Track your country’s fiscal health. [Get government budget and economic data tools here] 📊
Budget Deficits and Surpluses Around the World
Budget Balance as % of GDP (Illustrative)
| Country/Region | Budget Balance (% of GDP) | Status | Trend |
|---|---|---|---|
| United States | -5% to -7% | Large Deficit | Rising (debt accumulating) |
| United Kingdom | -4% to -6% | Moderate-Large Deficit | Post-COVID, energy crisis |
| Germany | -2% to -3% (recent deficits after surplus) | Moderate Deficit | Surplus pre-COVID; deficit post-COVID/energy |
| France | -5% to -6% | Large Deficit | Persistent (above EU rules) |
| Italy | -4% to -5% | Moderate-Large Deficit | Persistent (very high debt) |
| Spain | -4% to -5% | Moderate-Large Deficit | Improving from peak |
| Japan | -5% to -7% | Large Deficit | Persistent (very high debt) |
| Canada | -1% to -2% | Small Deficit | Improved significantly |
| Australia | -1% to -2% | Small Deficit | Strong fiscal position |
| Denmark | +1% to +3% | Surplus | Strong fiscal position |
| Norway | +5% to +15% | Large Surplus | Oil revenues (sovereign wealth fund) |
| China | -3% to -5% (official, but local deficits higher) | Moderate Deficit (official) | Rising (local government debt) |
Deficit/Surplus Categories
| Category | Budget Balance (% of GDP) | Risk Level | Examples |
|---|---|---|---|
| Large Surplus | >+3% | Very low (but may indicate underinvestment) | Norway (oil); some oil exporters |
| Small Surplus | 0% to +3% | Low | Denmark; Germany (pre-COVID) |
| Small Deficit | 0% to -3% | Low to Moderate | Canada; Australia; Germany (post-COVID) |
| Moderate Deficit | -3% to -6% | Moderate | US; UK; France; China (official) |
| Large Deficit | -6% to -10% | High | Crisis periods (2008, COVID-19) |
| Extreme Deficit | >-10% | Very High (emergency) | COVID-19 (2020); wartime |
Examples:
📍 Domestic Economy Example: The United States has run deficits averaging 3-5% of GDP pre-COVID, spiking to 15% during the pandemic (2020), and returning to 5-7% post-pandemic. This is high by historical peacetime standards (except 1980s, 2008-2010).
📍 Global Example: Norway runs large budget surpluses due to its North Sea oil and gas revenues. Instead of spending all the oil money, Norway saves most of it in a sovereign wealth fund (now over $1.5 trillion, the largest in the world). This fund invests globally for future generations.
👉 Compare fiscal positions across countries. [Get international economic comparison tools here] 🌍
Causes of Budget Deficits and Surpluses
Why Do Governments Run Deficits?
| Cause | Explanation | Examples |
|---|---|---|
| Recession (automatic stabilizers) | Tax revenues fall (people earn less, pay less tax); spending rises (unemployment benefits, food stamps). | 2008 financial crisis; COVID-19 pandemic; any recession. |
| Counter-cyclical policy (stimulus) | Government intentionally spends more or cuts taxes to boost demand during recessions. | American Recovery and Reinvestment Act (2009); CARES Act (2020); Inflation Reduction Act (2022). |
| War or national emergency | Defense spending surges; disaster relief spending. | World Wars; Iraq/Afghanistan wars; pandemic response. |
| Structural factors | Demographics (aging population → higher spending on healthcare, pensions); permanent tax cuts. | Social Security, Medicare, Medicaid in US; aging in Japan, Europe. |
| Political choices | Politicians prefer tax cuts and spending increases (popular); dislike tax increases or spending cuts (unpopular). | US tax cuts (Bush 2001/2003, Trump 2017) not paired with spending cuts. |
Why Do Governments Run Surpluses?
| Cause | Explanation | Examples |
|---|---|---|
| Strong economic growth | Tax revenues boom; spending may fall (less unemployment, welfare). | US late 1990s dot-com boom (surplus 1998-2001). |
| Austerity (spending cuts) | Government deliberately cuts spending (or raises taxes) to reduce deficit/debt. | UK austerity after 2008; European debt crisis (Greece, Spain, Italy). |
| Resource revenues (oil, gas, mining) | Natural resource exports generate large tax revenues. | Norway (oil); Saudi Arabia (oil); Australia (mining historically, but spent). |
| Debt brake laws | Constitutional or legal limits on deficits. | Germany’s “Schuldenbremse” (debt brake); EU Maastricht rules (violated often). |
Examples:
📍 Domestic Economy Example: The United States ran budget surpluses from 1998-2001 due to the dot-com boom (strong growth, capital gains tax revenues) and spending discipline (1990 budget agreement, Clinton-era policies). Since then, deficits have returned (tax cuts, wars, recession, pandemic).
📍 Global Example: Germany ran budget surpluses before COVID-19 due to strong exports, low unemployment, and fiscal discipline (debt brake). The pandemic forced Germany to suspend the debt brake and run deficits, but it plans to return to surplus over time.
👉 Understand the politics of fiscal policy. [Get policy analysis and economic forecasting tools here] 📊
Is a Budget Deficit Bad? Is a Surplus Good?
The Deficit Debate
| Argument | View | Explanation |
|---|---|---|
| Deficits are dangerous | Deficit Hawks | Deficits increase debt; debt crowds out private investment; future generations pay higher taxes; risk of debt crisis. |
| Deficits are necessary | Deficit Doves (Modern Monetary Theory, Keynesians) | In recessions, deficits stabilize the economy; public investment (infrastructure, education) boosts future growth; a country that borrows in its own currency can’t be forced to default. |
When Deficits Are Concerning (Red Flags)
| Red Flag | Explanation | Example |
|---|---|---|
| Persistent deficits even in good times | If deficits don’t shrink during booms, debt accumulates rapidly. | US deficits in 1990s (surplus) were good; deficits in 2010s (expansion) added to debt unnecessarily. |
| Rapidly rising debt-to-GDP | Debt growing faster than the economy (unsustainable). | Japan (already high); Italy (high debt, low growth). |
| High interest rates / loss of confidence | Investors demand higher yields; rolling over debt becomes expensive. | Greece (2010-2015); Italy (spreads vs. Germany). |
| Foreign currency debt | If a country borrows in foreign currency (not its own), it can’t inflate away the debt. | Emerging markets (Mexico 1994, Asia 1997, Argentina 2001). |
When Deficits Are Not Concerning
| Condition | Explanation | Example |
|---|---|---|
| Temporary recession response | Deficit during crisis prevents depression; pay back during recovery. | 2008 deficits; 2020 COVID deficits. |
| Borrowing in own currency | Government can always repay (or roll over) debt; no default risk (though inflation risk exists). | US, UK, Japan, Eurozone (ECB). |
| Investment that boosts growth | Borrowing to build infrastructure, education, R&D pays for itself. | Interstate highways (US); high-speed rail (Japan, Europe). |
| Low interest rates | If borrowing costs are below growth rate, debt is sustainable. | US post-2008 (low rates); Japan (low rates despite high debt). |
The Case for Budget Surpluses
| Benefit | Explanation |
|---|---|
| Pays down debt | Reduces interest burden; frees up resources for other priorities. |
| Provides cushion for future crises | Surplus means room to borrow during next recession. |
| Keeps interest rates low | Lower debt → lower risk premium → lower borrowing costs. |
| Fairness to future generations | Reduces tax burden on children and grandchildren. |
The Case Against Budget Surpluses
| Drawback | Explanation |
|---|---|
| Underinvestment | Surplus implies government is collecting more than it spends; could be investing in infrastructure, education, R&D, healthcare, climate. |
| Political difficulty | Surpluses often lead to pressure for tax cuts (which may be fine) or spending increases (which may be fine). |
| Economic drag | High taxes or low spending can slow growth (if economy is below potential). |
Examples:
📍 Domestic Economy Example: The United States runs large deficits even during expansions (2010s, 2020s). Deficit hawks worry about rising debt-to-GDP (now 120%+). Deficit doves argue that low interest rates make debt affordable, and that public investment (infrastructure, climate, healthcare) would boost growth.
📍 Global Example: Germany ran surpluses before COVID-19, reducing its debt-to-GDP ratio. This gave Germany fiscal room to borrow heavily during the pandemic and energy crisis without pushing debt to dangerous levels. Critics argue Germany underinvested in infrastructure, digitalization, and defense.
👉 Form your own view on fiscal policy. [Get economic research and analysis tools here] 📚
How Budget Deficits and Surpluses Affect the Economy
Short-Term Effects
| Fiscal Stance | Effect on Economy | Effect on Interest Rates |
|---|---|---|
| Expansionary (Deficit) | Stimulates demand (government spending adds to GDP; tax cuts leave more money for consumers). | Puts upward pressure on interest rates (government borrows, competing with private borrowers—”crowding out”). |
| Contractionary (Surplus) | Reduces demand (government spends less or taxes more). | Puts downward pressure on interest rates (government borrowing less). |
Long-Term Effects
| Effect | Deficit (High Debt) | Surplus (Low Debt) |
|---|---|---|
| Crowding out | Government borrowing consumes savings that could fund private investment → lower growth. | Government borrowing less → more savings available for private investment → higher growth. |
| Interest payments | More of the budget goes to interest, less to education, infrastructure, defense, healthcare. | Less of the budget goes to interest, more to productive spending. |
| Tax burden | Future taxes may need to rise to service debt. | Future taxes can be lower. |
| Crisis resilience | Less room to borrow during next recession (if debt is already high). | More room to borrow during next recession. |
The Crowding Out Debate
| View | Argument |
|---|---|
| Crowding out occurs | Government borrowing raises interest rates; private investment falls dollar-for-dollar. |
| No crowding out (liquidity trap) | When interest rates are near zero (recession), government borrowing does not raise rates; private investment not crowded out. |
| Crowding in | Government investment (infrastructure, education, R&D) raises productivity, increasing private investment. |
Examples:
📍 Domestic Economy Example: In the United States, crowding out was a concern in the 1980s (Reagan deficits raised rates). But post-2008 (zero rates, quantitative easing) and post-2020 (near-zero rates), deficits did not raise rates significantly. The debate continues.
📍 Global Example: Japan has very high debt (250%+ of GDP) but very low interest rates (near zero for decades). Despite high debt, Japan has not experienced crowding out because the Bank of Japan owns a large share of government bonds (keeping rates low).
👉 Position your portfolio for fiscal policy changes. [Get asset allocation and fixed-income tools here] 📈
How Budget Deficits and Surpluses Affect Your Money 💰
Direct and Indirect Impacts
| Fiscal Condition | Impact on You |
|---|---|
| Large deficits | • Potential for higher future taxes (to service debt) • Potential for higher interest rates (crowding out) • Inflation risk (if government monetizes debt) • Risk of reduced government services (interest crowds out spending) |
| Large surpluses | • Potential for lower taxes (if surplus returned) • Potential for lower interest rates (less borrowing) • More fiscal room for future crises • Risk of underinvestment (if surplus from spending cuts) |
How Deficits/Surpluses Affect Different Groups
| Group | Large Deficit Impact | Large Surplus Impact |
|---|---|---|
| Workers | Higher payroll taxes; risk of slower growth; inflation risk. | Lower taxes; stronger growth; less inflation risk. |
| Savers | Inflation risk; higher rates (if deficits push up rates) → higher savings returns (eventually). | Lower rates (if surplus reduces borrowing) → lower savings returns. |
| Borrowers | Higher rates (if deficits push up rates) → expensive mortgages, loans. | Lower rates → cheaper mortgages, loans. |
| Retirees | Risk to Social Security, Medicare (if interest crowds out spending). | More fiscal room for Social Security, Medicare. |
| Young people | Bear future tax burden; face slower growth if crowding out occurs. | Inherit lower debt; potentially lower taxes. |
Fiscal Policy and Investment Returns
| Asset Class | Large Deficit Impact | Large Surplus Impact |
|---|---|---|
| Stocks | Mixed: stimulus boosts growth (good), but higher rates (bad) and future taxes (bad). | Mixed: lower growth (if austerity), but lower rates (good) and lower future taxes (good). |
| Bonds | Large deficits → more bond issuance → potential for higher yields (good for new buyers, bad for existing bond holders). | Large surpluses → less bond issuance → potential for lower yields (bad for savers). |
| Real estate | Higher rates (if deficits push up rates) → lower affordability → lower prices. | Lower rates → higher affordability → higher prices. |
| Inflation hedges (gold, TIPS) | Deficits (especially if monetized) → inflation risk → gold, TIPS benefit. | Surpluses → less inflation risk → gold, TIPS less attractive. |
Examples:
📍Domestic Economy Example: In the United States, persistent deficits have not (yet) led to crisis. Interest rates remain moderate (though higher than 2010s), inflation has moderated, and the dollar remains strong. Investors continue to buy US Treasury bonds, trusting US creditworthiness.
📍 Global Example: In Greece (2010-2015), large deficits and high debt led to a debt crisis: interest rates spiked, the economy collapsed (GDP fell 25%), unemployment exceeded 25%, and the banking system nearly failed. This is the cautionary tale for deficit hawks.
👉 Protect your portfolio from fiscal risks. [Get portfolio management and risk analysis tools here] 🛡️
Fiscal Rules and Debt Brakes (Policy Responses)
Fiscal Rules Around the World
| Country/Region | Fiscal Rule | Details |
|---|---|---|
| European Union (Maastricht) | Deficit <3% of GDP; Debt <60% of GDP | Frequently violated; enforcement weak; under review. |
| Germany (Debt Brake) | Structural deficit <0.35% of GDP | Constitutional; suspended for emergencies (COVID, energy). |
| Switzerland (Debt Brake) | Balanced budget over economic cycle | Strong rule; widely respected. |
| United States | No formal fiscal rule | Debt ceiling (political, not economic); frequent crises. |
| United Kingdom | Various rules (changed frequently) | Weak enforcement; often replaced. |
| Brazil | Spending cap (real growth limit) | Recently weakened. |
Do Fiscal Rules Work?
| Evidence | Example |
|---|---|
| Yes, when enforced | Germany’s debt brake (pre-COVID) kept deficits low; Switzerland’s rule is respected. |
| No, when weak or unenforced | EU Maastricht rules widely violated (France, Italy, Spain, etc.). |
| Trade-off | Rules prevent excess but may prevent necessary stimulus (austerity can worsen recessions). |
Examples:
📍Domestic Economy Example: The United States has no formal fiscal rule, only a debt ceiling (a legal limit on borrowing that Congress must raise periodically). Debt ceiling fights have brought the US close to default (2011, 2013, 2023), causing credit rating downgrades (S&P downgraded US in 2011) and market volatility.
📍 Global Example: Germany’s debt brake (Schuldenbremse) limits structural deficits to 0.35% of GDP. It was suspended during COVID-19 (2020-2022) to allow pandemic spending, but Germany plans to reinstate it. Critics argue the debt brake forces underinvestment in infrastructure, digitalization, and defense.
👉 Stay informed on fiscal policy changes. [Get policy tracking and economic calendar tools here] 📅
Summary: Budget Deficit / Surplus
| Sub-Segment | Key Takeaway |
|---|---|
| 3.14.1 What Is Deficit/Surplus? | Deficit = spending > revenue (adds to debt); Surplus = revenue > spending (reduces debt). |
| 3.14.2 How It’s Calculated | Budget balance = revenue – spending; deficit as % of GDP is key metric. |
| 3.14.3 Deficits/Surpluses Around World | US large deficit (5-7% of GDP); Germany moderate deficit (post-COVID); Norway large surplus (oil). |
| 3.14.4 Causes | Deficits: recession, stimulus, war, demographics, political choices. Surpluses: strong growth, austerity, resource revenues, debt brakes. |
| 3.14.5 Is Deficit Bad? | Not always: temporary recession deficits are fine; persistent deficits in good times are concerning. Surpluses good for debt reduction but may mean underinvestment. |
| 3.14.6 How It Affects Economy | Short-term: deficits stimulate demand; surpluses contract. Long-term: deficits risk crowding out and higher taxes. |
| 3.14.7 How It Affects Your Money | Deficits: higher future taxes, potentially higher rates, inflation risk. Surpluses: lower taxes, lower rates, less risk. |
| 3.14.8 Fiscal Rules | EU (3% deficit rule), Germany debt brake, US debt ceiling (political fights). |
🌟 Final Thoughts on Budget Deficit / Surplus
Understanding the economy requires mastering budget deficits and surpluses—but also recognizing that context matters enormously.
| Do This | Don’t Do This |
|---|---|
| ✅ Distinguish between deficits during recessions (necessary) and deficits during booms (concerning). | ❌ Assume all deficits are bad (or all deficits are good)—context matters. |
| ✅ Understand the difference between deficit (flow) and debt (stock). | ❌ Forget that a country borrowing in its own currency has more flexibility than one borrowing in foreign currency. |
| ✅ Consider the interest rate vs. growth rate (if growth > interest, debt is sustainable). | ❌ Ignore the risk of debt crises (Greece, Argentina) when debt is high and confidence is lost. |
| ✅ Watch for signs of unsustainable deficits (rising debt-to-GDP, rising interest rates, loss of confidence). | ❌ Believe that deficits never matter (Modern Monetary Theory oversimplifies; there are limits). |
The budget deficit is not a simple morality play (deficits = bad, surpluses = good). Temporary deficits during recessions save jobs and prevent depressions. Persistent deficits during good times accumulate debt, crowd out investment, and burden future generations. Smart fiscal policy balances short-term stabilization with long-term sustainability.
By understanding budget deficits and surpluses, you can make better decisions as a voter, an investor, and a citizen—and better understand the domestic and global economy.
👉 Become a more informed investor and citizen. [Get premium economic and fiscal policy analysis tools here] 🚀
❓ Frequently Asked Questions (FAQs) – Budget Deficit / Surplus
Read More
Q1: What is the difference between the deficit and the debt?
The deficit is the annual shortfall (spending – revenue). The debt is the total accumulated borrowing over time. Deficits add to debt; surpluses reduce debt.
Q2: Why does the US run such large deficits?
Multiple factors: tax cuts (Bush, Trump) without spending cuts; wars (Iraq, Afghanistan); recession response (2008, 2020); rising mandatory spending (Social Security, Medicare, Medicaid) due to aging population; political gridlock (difficult to cut spending or raise taxes).
Q3: Is a budget deficit always bad for the economy?
No. Deficits during recessions (2008, 2020) stabilize the economy, saving jobs and preventing depressions. Deficits to finance productive investment (infrastructure, education, R&D) can boost future growth. Persistent deficits during good times are more concerning.
Q4: Which country has the largest budget surplus?
Norway runs large surpluses due to oil and gas revenues, saving most in a sovereign wealth fund (now $1.5+ trillion). Other oil exporters (Saudi Arabia, UAE, Kuwait) also run surpluses when oil prices are high.
Q5: Which country has the largest budget deficit (as % of GDP)?
During crises, deficits can reach 10-20% of GDP (US 2020: 15%). In normal times, the US, UK, France, Italy, and Japan run persistent deficits of 3-7% of GDP.
Q6: What is the debt ceiling?
The debt ceiling is a US legal limit on total government debt. Congress must vote to raise it periodically to avoid default. Debt ceiling fights have brought the US close to default (2011, 2013, 2023), causing credit rating downgrades and market volatility.
Q7: Can a country with high debt ever recover?
Yes. After WWII, UK debt-to-GDP exceeded 250%. It was reduced through decades of growth, inflation, and financial repression. US debt-to-GDP fell from over 100% after WWII to under 40% by 1970s. Japan has very high debt (250%+) but low rates and no crisis (so far).
👉 Stay ahead of fiscal trends. [Get economic forecasting and investment research tools here] 📊
📌 What Is a Deficit? – Quick Reference
Concise explanation of Deficit.
✅ Deficit Simple Definition
A deficit occurs when a government (or any entity) spends more money than it receives in revenue over a specific period (usually a year).
Simple Definition: Spending > Revenue = Deficit. You’re spending more than you’re taking in. 💳
📊 Deficit at a Glance
| Term | Definition | Formula | Example |
|---|---|---|---|
| Budget Deficit | When government spending exceeds government revenue. | Spending – Revenue = POSITIVE number | Government spends $6 trillion, collects $4.5 trillion → Deficit = $1.5 trillion |
| Budget Surplus | When government revenue exceeds government spending. | Revenue – Spending = POSITIVE number | Government collects $5 trillion, spends $4.5 trillion → Surplus = $0.5 trillion |
| Balanced Budget | When spending equals revenue. | Spending = Revenue | Government spends $5 trillion, collects $5 trillion → Balanced |
🔑 The Most Important Thing to Remember
Deficit (Flow) adds to Debt (Stock)
| Concept | Definition | Analogy |
|---|---|---|
| Deficit | Annual shortfall (how much you overspend each year). | How much you add to your credit card balance each month. |
| Debt | Total accumulated borrowing over time. | Your total credit card balance. |
Year 1: Deficit = $1 trillion  →  Debt increases by $1 trillion
Year 2: Deficit = $1 trillion  →  Debt increases by another $1 trillion
Year 3: Surplus = $0.5 trillion → Debt decreases by $0.5 trillion

After 3 years: Total Debt Change = +$1.5 trillion
📌 Real-World Example (United States)
| Year | Revenue | Spending | Deficit/Surplus | What Happens to Debt |
|---|---|---|---|---|
| 2023 | $4.5 trillion | $6.0 trillion | -$1.5 trillion (Deficit) | Debt INCREASES |
| 1999 | $1.8 trillion | $1.7 trillion | +$0.1 trillion (Surplus) | Debt DECREASES |
✅ Quick Summary
| If Government Runs… | Public Debt Will… |
|---|---|
| Budget Deficit (spending > revenue) | INCREASE (adds to debt) |
| Budget Surplus (revenue > spending) | DECREASE (pays down debt) |
| Balanced Budget (spending = revenue) | STAY THE SAME (no change) |
📑 Table of Contents
- Page 1 – Segment 1 – Fabrics of Economy – The Interconnected Threads That Weave the Domestic and Global Economy 🧵🌍🔗
- Page 2 – Segment 2 – Introduction to Economy – What Is an Economy? 🌍📦💰
- Page 3 – Segment 3 – Metrics of Economy (Economic Indicators) 📊📈💰
- Page 4 – Segment 3.3 – Deep Dive: GDP and Economic Growth Indicators
- Page 5 – Segment 3.4 – Unemployment Rate – The Job Market Thermometer 👥📊💼
- Page 6 – Segment 3.5 – Inflation Rate – The Thief of Purchasing Power 🔥💸📉
- Page 7 – Segment 3.6 – Interest Rates – The Price of Money 🏦💰📊
- Page 8 – Segment 3.7 – Balance of Trade – Exports vs. Imports 📦🌍📊
- Page 9 – Segment 3.8 – Exchange Rates – The Price of Money in Global Markets 💱🌍📊
- Page 10 – Segment 3.9 – Public Debt (Government Debt) – The National Credit Card 🏦📊💰
- Page 11 – Segment 3.10 – Poverty Rate – Measuring Economic Hardship 📊💔💰
- Page 12 – Segment 3.11 – Income Inequality (Gini Coefficient) – Measuring the Wealth Gap ⚖️📊💰
- Page 13 – Segment 3.12 – Labor Productivity – The Engine of Prosperity 📈👥💰
- Page 14 – Segment 3.13 – Foreign Direct Investment (FDI) – Global Capital Flows 🌍💰🏭
- Page 15 – Segment 3.14 – Budget Deficit / Surplus – The Government's Checkbook 📋💰 📍
- Page 16 – Segment 3.15 – Human Development Index (HDI) – Beyond GDP 📊❤️
- Page 17 – Segment 3.16 – Stock Market Performance – The Investor's Dashboard 📈📊💰
- Page 18 – Segment 3.17 – Savings Rate – The Foundation of Financial Security 🏦💰
- Page 19 – Segment 4 – Microeconomics – The Science of Individual Economic Decisions 🔬🏪📊
- Page 20 – Segment 5 – Other Branches of Economics – Specialized Fields Beyond Microeconomics 🌍📚🔬
- Page 21 – Segment 6 – Nesting Branches of Economy – The Hierarchical Structure of Economic Knowledge 🪆📚🔬
- Page 22 – Segment 7 – Products Related to the Economy – Tools for Financial Success 🛍️📊💰
- Page 23 – Segment 8 – Economics vs. Economy – The Difference Between the Study and the System 🎓🌍
- Page 24 – Segment 9 – Economic Systems & Related Concepts – How Societies Organize Resources ⚖️🌍🏛️
- Page 25 – Segment 10 – Globalization and Economic Interdependence – The Connected World 🌐🤝📦
- Page 26 – Segment 11 – Role of Fiscal and Monetary Policies – The Government's Economic Toolkit 🏛️🏦
- Page 27 – Segment 12 – Inflation and Its Impact – The Silent Thief of Purchasing Power 🔥💸
- Page 28 – Segment 13 – Introduction to Economy – Expanded SEO FAQs ❓📚🔍
- Page 29 – Segment 14 – Micro-Categories within the Economy Category – Specialized Areas for Deeper Understanding 🎯📊🔍
- Page 30 – Segment 15 – Understanding the Economy – A Practical Guide to Your Financial Life 🚀📊💰
- Page 31 – Segment 16 – The "Economics of the Economy" – Foundational Principles 📚🔑
- Page 32 – Segment 17 – Closing Thoughts – Mastering the Domestic and Global Economy 🌟🌍
- Page 33 – Segment 18 – 300 FAQS