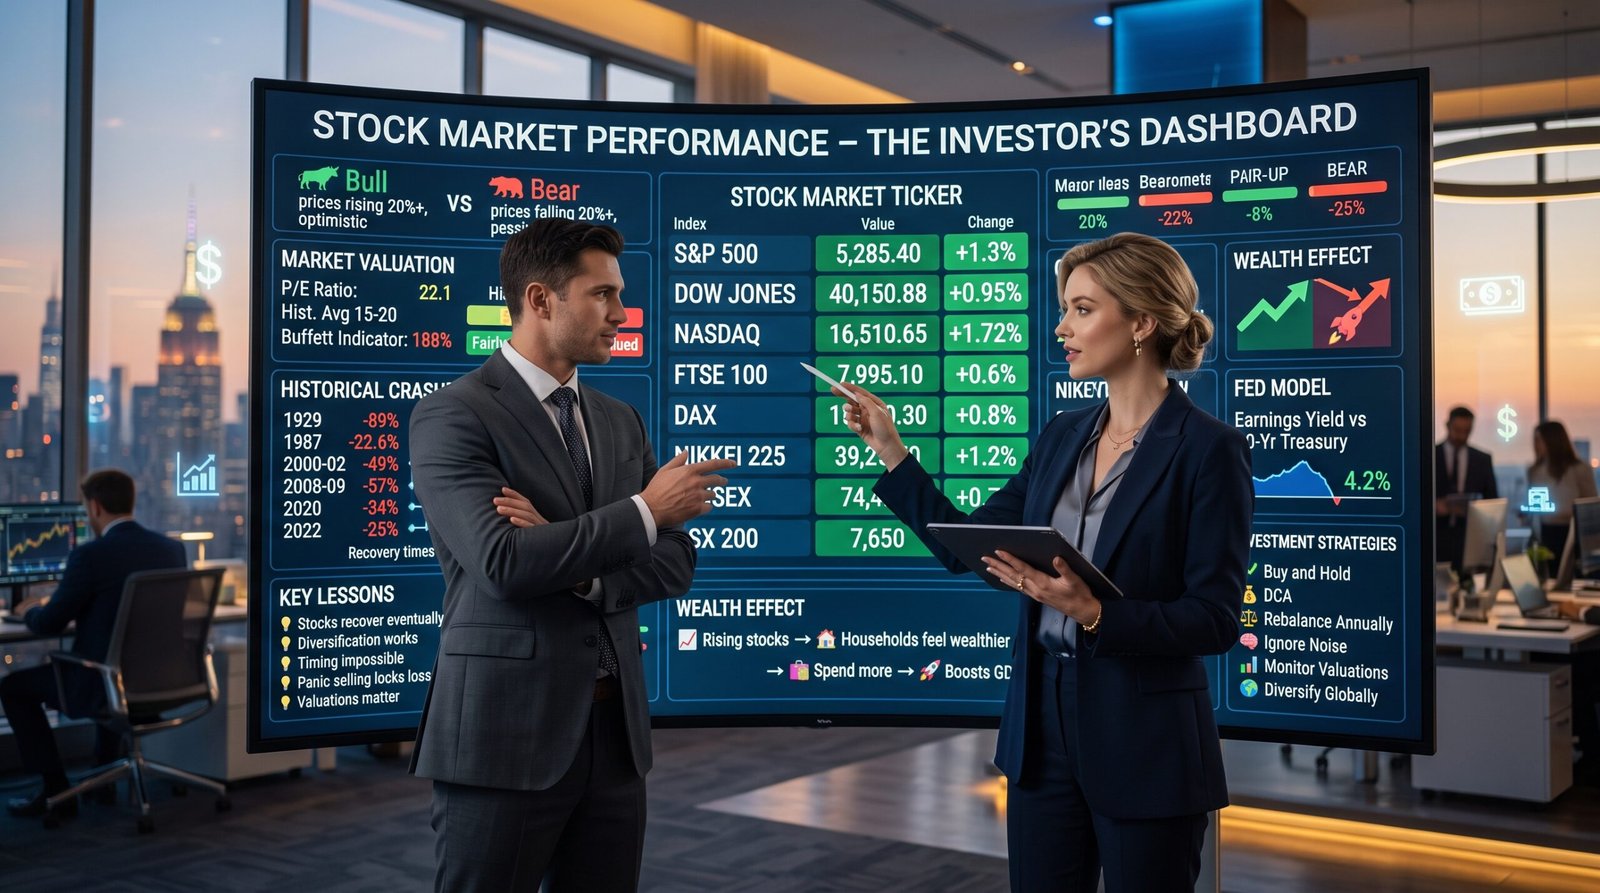
How Market Trends Reflect the Domestic and Global Economy
Rise. Fall. Invest. 📉
When understanding the economy, the stock market serves as a real-time barometer of investor confidence, corporate profits, and economic expectations. Whether you are in the United States 🇺🇸, United Kingdom 🇬🇧, Europe 🇪🇺, Asia 🌏, Australia 🇦🇺, or anywhere else globally 🌐, stock market performance affects your retirement savings, your investment portfolio, and even your job security (through corporate confidence and capital availability).
In this Segment, we dive deep into stock market performance—what it measures, how it’s tracked, what the numbers mean for the domestic and global economy, the relationship between stocks and the economy, and why it matters for your money.
👉 Track stock market performance like a pro. [Get real-time market data and trading platforms here] 📈
What Is Stock Market Performance? (Definition)
The Simple Definition
Stock market performance refers to how stock prices (shares of publicly traded companies) change over time. It is typically measured by stock market indices—baskets of representative stocks that track the overall market or specific sectors.
Simple Definition: Are stock prices going up (bull market) or down (bear market)? 🐂 vs. 🐻
Major Stock Market Indices (Global Benchmarks)
| Index | Country/Region | What It Tracks | Number of Companies | Nickname |
|---|
| S&P 500 | United States | 500 largest US publicly traded companies | 500 | The broad US market benchmark |
| Dow Jones Industrial Average (DJIA) | United States | 30 large, established US companies | 30 | “The Dow” (oldest, but narrow) |
| NASDAQ Composite | United States | All stocks on NASDAQ exchange (tech-heavy) | 3,000+ | Tech benchmark |
| Russell 2000 | United States | 2,000 small-cap US companies | 2,000 | Small-cap benchmark |
| FTSE 100 | United Kingdom | 100 largest London-listed companies | 100 | “Footsie” |
| DAX | Germany | 40 largest German companies (Frankfurt) | 40 | German benchmark |
| CAC 40 | France | 40 largest French companies (Paris) | 40 | French benchmark |
| Euro Stoxx 50 | Eurozone | 50 largest eurozone companies | 50 | Eurozone benchmark |
| Nikkei 225 | Japan | 225 large Japanese companies (Tokyo) | 225 | Japanese benchmark |
| Hang Seng | Hong Kong | Largest Hong Kong-listed companies | 50-80 | Hong Kong/China benchmark |
| Shanghai Composite | China | All stocks on Shanghai exchange | 1,500+ | China mainland benchmark |
| SENSEX | India | 30 largest Bombay-listed companies | 30 | Indian benchmark |
| ASX 200 | Australia | 200 largest Australian companies | 200 |
Examples:
📍Domestic Economy Example: In the United States, the S&P 500 is the most widely followed stock market index. When financial news says “the market is up 1% today,” they usually mean the S&P 500. It represents about 80% of US stock market value.
📍 Global Example: In Europe (UK, Germany, France) , the FTSE 100 (UK), DAX (Germany), and CAC 40 (France) are the primary benchmarks. The Euro Stoxx 50 tracks the largest 50 companies across the eurozone, allowing investors to track European markets as a whole.
👉 Start investing in global markets. [Discover international brokerage and ETF platforms here] 🌍
How Stock Market Performance Is Measured
Key Metrics for Understanding Stock Market Performance
| Metric | Definition | What It Tells You |
|---|
| Index Level | The numeric value of the index (e.g., S&P 500 at 5,000). | Current market valuation (relative to history). |
| Return (1-day, 1-month, 1-year, 5-year, 10-year) | Percentage change in index value over a period. | How much money you would have made (or lost) over that period. |
| Volatility | How much prices swing up and down (measured by VIX “fear index”). | Riskiness of the market; uncertainty level. |
| Price-to-Earnings Ratio (P/E) | Stock price divided by earnings per share. | How expensive or cheap the market is (valuation). |
| Dividend Yield | Annual dividend divided by stock price. | Income return from stocks (vs. capital gains). |
| Market Capitalization | Total value of all shares of all companies in the index. | Size of the stock market relative to GDP. |
Bull Market vs. Bear Market
| Market Condition | Definition | Investor Sentiment | Economic Context |
|---|
| Bull Market | Stock prices rising (typically 20%+ from recent low). | Optimistic, confident, greedy. | Expanding economy (usually); low unemployment; rising corporate profits. |
| Bear Market | Stock prices falling (typically 20%+ from recent high). | Pessimistic, fearful, panicked. | Contracting economy (recession often); rising unemployment; falling profits. |
Examples:
📍Domestic Economy Example: The United States experienced a bear market in 2022 (S&P 500 fell ~20-25%) as the Federal Reserve raised interest rates to fight inflation. In 2023-2024, a bull market resumed as inflation cooled and the economy avoided recession (“soft landing”).
📍 Global Example: Japan’s Nikkei 225 experienced a bear market that lasted decades (1989-2012) after the asset bubble burst—the “Lost Decades.” It finally surpassed its 1989 peak in 2024, a 35-year recovery.
👉 Navigate bull and bear markets. [Get market analysis and trading tools here] 📊
Stock Market Performance Around the World (Global Comparison)
Long-Term Returns by Market (Approximate Annualized)
Stock Market Capitalization to GDP (Buffett Indicator)
The Buffett Indicator (stock market cap divided by GDP) measures whether the stock market is overvalued or undervalued relative to the economy.
| Ratio | Valuation | Interpretation |
|---|
| Below 50% | Undervalued | Good buying opportunity (historically). |
| 50-75% | Moderately undervalued | Favorable for long-term investors. |
| 75-90% | Fairly valued | Normal range. |
| 90-115% | Moderately overvalued | Caution warranted. |
| 115-150% | Significantly overvalued | High risk of correction. |
| Above 150% | Extreme overvaluation | Bubble territory (dot-com: 150%+; 2021: 200%+). |
Examples:
📍Domestic Economy Example: The United States Buffett Indicator exceeded 200% in 2021—the highest in history, exceeding even the dot-com bubble (150%). This suggested stocks were extremely overvalued. The 2022 bear market (down ~20-25%) reduced valuation but still left the US market expensive by historical standards.
📍 Global Example: China’s stock market cap to GDP is much lower than the US (60-80%), reflecting state ownership of many large companies (which are not publicly traded). This makes the Buffett Indicator less useful for China.
👉 Track market valuations. [Get valuation and market analysis tools here] 📈
What Drives Stock Market Performance?
Fundamental Drivers
| Driver | Explanation | Example |
|---|
| Corporate Profits (Earnings) | Stock prices ultimately reflect the present value of future profits. | Rising earnings → rising stocks; falling earnings → falling stocks. |
| Interest Rates | Lower rates → lower discount rate → higher stock valuations; higher rates → lower valuations. | Fed rate hikes in 2022 → P/E multiples contracted. |
| Economic Growth (GDP) | Strong growth → higher corporate profits → higher stocks. | US GDP growth 2-3% supports moderate stock returns. |
| Inflation | Moderate inflation okay; high inflation hurts (uncertainty, higher rates, margin compression). | 1970s stagflation: bad for stocks; 2022 inflation: caused bear market. |
| Investor Sentiment (Fear/Greed) | Emotions drive short-term price movements (overshooting). | Panic selling during COVID-19 (March 2020); euphoria in 2021. |
| Geopolitics | War, trade tensions, political instability affect markets. | Russia-Ukraine war → energy price spike → market volatility. |
| Innovation & Disruption | New technologies create new winners (and losers). | AI boom → Nvidia, Microsoft, Alphabet surge. |
The Fed Model: Stocks vs. Bonds
Investors compare stock returns (earnings yield = 1 ÷ P/E ratio) to bond yields (10-year Treasury).
| Condition | Implication for Stocks |
|---|
| Earnings Yield > Bond Yield | Stocks attractive relative to bonds (historically). |
| Earnings Yield < Bond Yield | Bonds attractive relative to stocks (stocks expensive). |
Examples:
📍 Domestic Economy Example: In the United States, when the 10-year Treasury yield rose from 1-2% (2020-2021) to 4-5% (2023-2024), stocks became less attractive relative to bonds. This contributed to the 2022 bear market and slower subsequent returns.
📍 Global Example: In Japan, bond yields have been near zero for decades (and sometimes negative). This made stocks relatively attractive, contributing to the Nikkei’s recovery after 2012.
👉 Make informed investment decisions. [Get fundamental analysis and research tools here] 📚
Stock Market vs. The Economy (They Are Not the Same)
The Stock Market Is Not the Economy
| Misconception | Reality |
|---|
| “If the stock market is up, the economy must be strong.” | Stock market can rise even during recessions (if investors anticipate recovery) and can fall during strong economies (if interest rates rise). |
| “If the stock market crashes, the economy will crash.” | Severe stock crashes (1929, 2008) can cause recessions (wealth effect), but not always (1987 crash did not cause recession). |
| “The stock market predicts the economy.” | Stock market is a leading indicator (predicts 6-9 months ahead) but is noisy and often wrong. |
How the Stock Market Affects the Economy (Wealth Effect)
| Mechanism | Explanation |
|---|
| Wealth Effect | When stocks rise, households feel wealthier and spend more → boosts GDP. When stocks fall, households feel poorer and spend less → reduces GDP. |
| Corporate Investment | High stock prices → companies can raise cheap capital (equity) → expand, hire, invest. Low stock prices → capital difficult → cutbacks. |
| Confidence | Rising stocks boost consumer and business confidence; falling stocks reduce confidence. |
Examples:
📍 Domestic Economy Example: The United States wealth effect is powerful because about 50-60% of households own stocks (directly or through retirement accounts like 401(k)s, IRAs). The 2020-2021 stock market rally (despite pandemic) boosted household wealth, fueling consumer spending and contributing to inflation.
📍 Global Example: In Europe (Germany, France, Italy) , fewer households own stocks directly (pensions are often pay-as-you-go or funded by bonds). The wealth effect is weaker; stock market swings have less direct impact on consumer spending.
👉 Understand the stock-economy connection. [Get economic and market correlation tools here] 📊
How Stock Market Performance Affects Your Money 💰
Direct Impacts on Your Wallet
| Stock Market Condition | Impact on You |
|---|
| Rising Market (Bull) | • Your 401(k), IRA, and brokerage accounts grow • Wealth effect: you feel richer, may spend more • Companies raise capital, hire • More IPOs, M&A activity |
| Falling Market (Bear) | • Your retirement savings shrink (if you sell; if you hold, recover eventually) • Wealth effect: you feel poorer, may cut spending • Companies struggle to raise capital • Layoffs, cutbacks |
Stock Market and Different Investor Types
| Investor Type | Rising Market Impact | Falling Market Impact |
|---|
| Young (accumulating) | Good for existing savings; bad for future purchases (prices high). | Good (buying opportunity) if you keep buying. |
| Middle-aged (accumulating) | Good (net worth grows). | Bad (net worth falls), but still time to recover. |
| Near retirement (decumulating) | Very good (locking in gains). | Very bad (sequence-of-returns risk). |
| Retired (spending down) | Good (portfolio lasts longer). | Bad (selling into bear market hurts). |
The 4% Rule and Sequence-of-Returns Risk
| Scenario | Retiree Portfolio | Impact |
|---|
| Retire in bull market (1990) | Withdraw 4% annually; portfolio grows. | Success (portfolio lasts 30+ years). |
| Retire in bear market (2000, 2008, 2022) | Withdraw 4% annually; portfolio declines. | Failure risk (running out of money). |
Examples:
📍 Domestic Economy Example: A United States retiree who retired in 2000 (dot-com crash) or 2008 (financial crisis) faced “sequence-of-returns risk”—selling stocks at low prices early in retirement. Those retirees had to withdraw less (or work longer) to avoid running out of money.
📍 Global Example: A Japanese retiree who retired in 1990 (Nikkei peak) faced a 35-year bear market. Someone who retired in 1990 with a portfolio heavily in Japanese stocks would have been devastated. Diversification globally would have saved them.
👉 Protect your retirement from market risk. [Get retirement planning and asset allocation tools here] 🛡️
Historical Stock Market Crashes and Lessons
Major Crashes (US and Global)
| Crash | Year | Decline | Cause | Recovery Time |
|---|
| Great Depression | 1929-1932 | -89% | Speculation, margin debt, banking panic, Fed mistakes. | 25 years (nominal); 15 years (real, including dividends). |
| Black Monday | 1987 | -22% (one day) | Program trading, portfolio insurance, market panic. | 2 years (fast recovery). |
| Dot-Com Bubble | 2000-2002 | -49% | Tech speculation, overvaluation (P/E ratios absurd). | 7 years (nominal); 13 years (real, including NASDAQ recovery). |
| Financial Crisis | 2008-2009 | -57% | Housing bubble, subprime mortgages, Lehman collapse. | 4 years (nominal); 6 years (real). |
| COVID-19 Crash | 2020 | -34% | Pandemic lockdowns, fear of economic collapse. | 6 months (fastest recovery in history, due to stimulus). |
| 2022 Bear Market | 2022 | -25% | Fed rate hikes, inflation, Russia-Ukraine war. | 1-2 years (recovered by late 2023/early 2024). |
Key Lessons for Investors
| Lesson | Explanation |
|---|
| Stocks recover (eventually) | Every bear market in history has been followed by a new bull market. Recovery time varies (6 months to 25 years). |
| Diversification works | Don’t put all your eggs in one country, sector, or asset class. |
| Timing the market is impossible | Missing the best days destroys returns. Time in the market beats timing the market. |
| Panic selling locks in losses | Those who sold in March 2020 missed the fastest recovery in history. |
| Valuations matter | Buying at high P/E ratios (dot-com, 2021) leads to lower future returns. |
Examples:
📍 Domestic Economy Example: An investor who sold all stocks during the COVID-19 crash (March 2020) and waited to “get back in” missed the fastest recovery in history. The S&P 500 bottomed on March 23, 2020, and was back to all-time highs by August 2020.
📍 Global Example: A Japanese investor who bought the Nikkei at its peak (1989) waited 35 years to recover (2024). This teaches: diversify globally. A Japanese investor with a globally diversified portfolio would have recovered much faster.
👉 Learn from market history. [Get investment education and historical data tools here] 📚
How to Use Stock Market Performance in Your Investing
For Long-Term Investors
| Strategy | Explanation |
|---|
| Buy and hold | Don’t try to time the market. Stay invested for decades. |
| Dollar-cost averaging (DCA) | Invest fixed amounts regularly (monthly, quarterly). Buys more shares when prices low, fewer when high. |
| Rebalance annually | Sell winners, buy losers to maintain target allocation. |
| Ignore the noise | Don’t panic at daily, weekly, or even monthly moves. Focus on long-term fundamentals. |
For Active/Tactical Investors
| Strategy | Explanation |
|---|
| Monitor valuations (P/E, CAPE) | Reduce exposure when valuations extreme (2021); increase when valuations low (2009, March 2020). |
| Watch interest rates | Rising rates hurt growth stocks, help value stocks. Falling rates help growth, hurt savers. |
| Follow earnings | Stock prices follow earnings over the long term. |
| Use stop losses (cautiously) | Protect against catastrophic losses, but can trigger selling at wrong time. |
Examples:
📍Domestic Economy Example: A United States investor using dollar-cost averaging (investing $1,000 monthly into S&P 500) would have bought shares at lower prices during the 2000-2002, 2008-2009, 2020, and 2022 bear markets—boosting long-term returns compared to lump-sum investing at peaks.
📍 Global Example: An investor anywhere globally who rebalanced annually (selling some US stocks after their 2010s boom to buy lagging international stocks) would have improved diversification and reduced volatility.
👉 Implement smart investing strategies. [Get portfolio management and rebalancing tools here] 📊
Summary: Stock Market Performance
| Sub-Segment | Key Takeaway |
|---|
| 3.16.1 What Is Stock Market Performance? | Stock indices (S&P 500, FTSE 100, Nikkei, etc.) track market prices; bull = rising, bear = falling. |
| 3.16.2 How It’s Measured | Index level, returns, volatility, P/E, dividend yield, market cap. |
| 3.16.3 Performance Around World | US strongest long-term returns; India high growth; Japan recovered from Lost Decades. |
| 3.16.4 What Drives Performance | Corporate profits, interest rates, GDP growth, inflation, sentiment, geopolitics, innovation. |
| 3.16.5 Stock Market vs. Economy | Not the same; stock market is leading indicator but noisy; wealth effect links them. |
| 3.16.6 How It Affects Your Money | Direct impact on retirement savings (401k, IRA); sequence-of-returns risk for retirees. |
| 3.16.7 Historical Crashes | 1929, 1987, 2000, 2008, 2020, 2022; lesson: stocks recover, don’t panic sell. |
| 3.16.8 Smart Investing Strategies | Buy and hold, DCA, rebalance, ignore noise; monitor valuations, rates, earnings. |
🌟 Final Thoughts on Stock Market Performance
Understanding the economy requires mastering stock market performance—but also recognizing that the market is not the economy.
| Do This | Don’t Do This |
|---|
| ✅ Use stock market performance as one indicator of economic health (not the only one). | ❌ Assume the stock market is the economy (they differ significantly). |
| ✅ Stay invested for the long term (time in market > timing the market). | ❌ Panic sell during bear markets (locks in losses; recover eventually). |
| ✅ Diversify across countries, sectors, and asset classes. | ❌ Put all your money in one country’s stock market (Japan 1989: 35-year recovery). |
| ✅ Monitor valuations (P/E, CAPE, Buffett Indicator) to avoid bubbles. | ❌ Chase past performance (buying after huge run-ups usually ends badly). |
The stock market can be a powerful wealth-building tool—but only if you understand its risks, history, and relationship to the domestic and global economy. By mastering stock market performance, you can make smarter investment decisions, grow your retirement savings, and achieve your financial goals.
👉 Start your investing journey today. [Get brokerage accounts, research tools, and investment education here] 🚀
❓ Frequently Asked Questions (FAQs) – Stock Market Performance