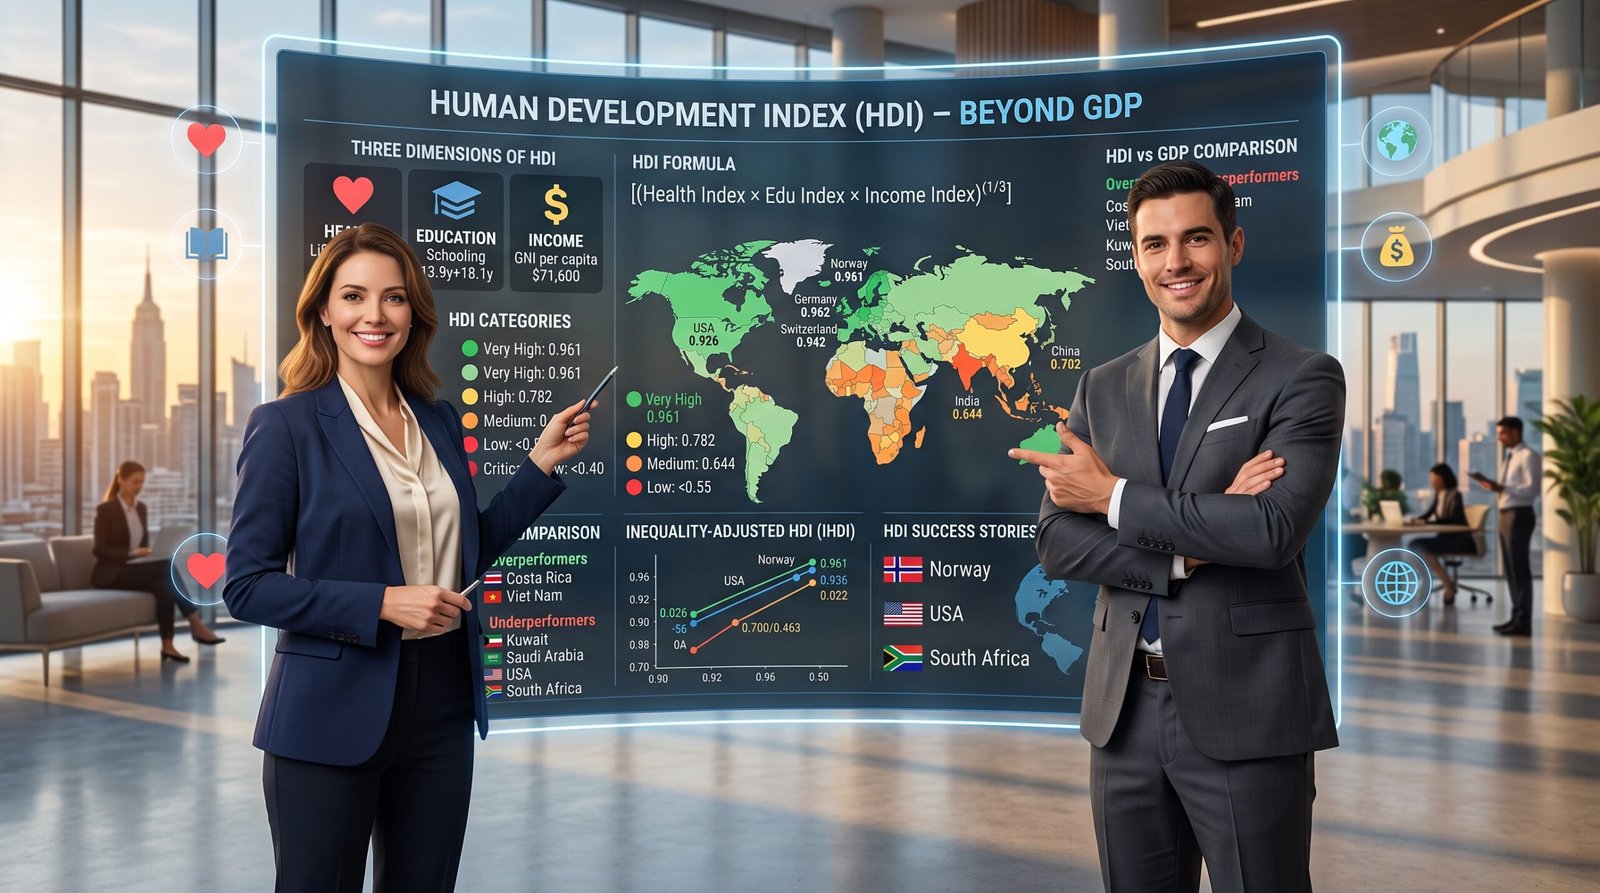
Measuring True Progress in the Domestic and Global Economy
Health. Education. Income. 📚
When understanding the economy, GDP tells you how rich a country is, but the Human Development Index (HDI) tells you whether that wealth translates into better lives. Whether you are in the United States 🇺🇸, United Kingdom 🇬🇧, Europe 🇪🇺, Asia 🌏, Australia 🇦🇺, or anywhere else globally 🌐, HDI reveals the true purpose of economic activity: enabling people to live long, educated, and prosperous lives.
In this Segment, we dive deep into the Human Development Index (HDI) —what it measures, how it’s calculated, what the numbers mean for the domestic and global economy, why it matters beyond GDP, and how it affects your money.
👉 Invest in human development. [Discover ESG and impact investing platforms here] 🌿
What Is the Human Development Index (HDI)? (Definition)
The Simple Definition
The Human Development Index (HDI) is a composite statistic measuring a country’s average achievement in three basic dimensions of human development: health (long life), education (knowledge), and standard of living (decent income) .
Simple Definition: HDI measures whether people live long, learn well, and earn enough. 📏
Who Creates the HDI?
The United Nations Development Programme (UNDP) publishes the HDI annually in its Human Development Report. The first report was published in 1990 by Nobel laureate economist Amartya Sen and Pakistani economist Mahbub ul Haq.
The Core Philosophy: Beyond GDP
| Traditional View | Human Development View |
|---|
| Economic growth (GDP) is the goal. | Economic growth is a means to human development, not the end itself. |
| A rich country is necessarily a good country. | A country can be rich but have poor health, education, and inequality. |
| Policy should maximize GDP. | Policy should maximize human well-being (long, healthy, educated lives). |
Examples:
📍 Domestic Economy Example: The United States has the world’s highest GDP but does not have the highest HDI. Several countries (Norway, Switzerland, Ireland, Germany) have comparable or higher HDI despite smaller economies, because they invest more in health and education.
📍 Global Example: Costa Rica has a higher HDI than many wealthier countries because it invests heavily in healthcare and education. Life expectancy in Costa Rica (80+ years) is higher than in the United States (76-78 years), despite GDP per capita being much lower.
👉 Understand true development. [Get global development data and analysis tools here] 📊
The Three Dimensions of HDI
Dimension 1: Health (Long and Healthy Life)
Dimension 2: Education (Knowledge)
| Metric | Definition | Source | Why It Matters |
|---|
| Mean Years of Schooling | Average number of years of education received by adults aged 25+. | UNESCO, Barro-Lee dataset | Reflects educational attainment of the adult population. |
| Expected Years of Schooling | Number of years of education a child of school-entry age can expect to receive. | UNESCO | Reflects future educational attainment (investment in children). |
Dimension 3: Standard of Living (Decent Income)
Examples:
📍 Domestic Economy Example: In the United States, life expectancy is 76-78 years (lower than many peer countries). Mean years of schooling is 13-14 years (high). GNI per capita is very high ($70,000+). The US scores well on education and income but poorly on health compared to other developed countries.
📍 Global Example: In Japan, life expectancy is among the highest in the world (84-85 years). Education is also very high. GNI per capita is high ($40,000+). Japan’s HDI is very high (0.92+), driven especially by health outcomes.
👉 Invest in human capital. [Explore education and healthcare investment platforms here] 🏥
How HDI Is Calculated
The HDI Formula (2024 Methodology)
For each dimension, the UNDP creates an index (0 to 1) using the formula:
Dimension Index = (Actual Value – Minimum Value) ÷ (Maximum Value – Minimum Value)
Then the HDI is the geometric mean (not arithmetic mean) of the three dimension indices:
HDI = (Health Index × Education Index × Income Index)^(1/3)
Minimum and Maximum Values (Fixed)
| Dimension | Indicator | Minimum | Maximum |
|---|
| Health | Life expectancy (years) | 20 | 85 |
| Education | Mean years of schooling (years) | 0 | 15 |
| Education | Expected years of schooling (years) | 0 | 18 |
| Income | GNI per capita (PPP, USD) | $100 | $75,000 |
Step-by-Step Calculation Example
| Step | Action | Example (Norway) |
|---|
| 1 | Health index: (Life expectancy – 20) ÷ (85 – 20) | (82.5 – 20) ÷ 65 = 0.962 |
| 2 | Education index: (Mean years – 0) ÷ 15 | (13.5 – 0) ÷ 15 = 0.900 |
| 3 | Expected years index: (Expected years – 0) ÷ 18 | (18.5 – 0) ÷ 18 = 1.028 (capped at 1.000) |
| 4 | Education index (combined) = (Mean index × Expected index)^(1/2) – 0 | (0.900 × 1.000)^(0.5) = 0.949 |
| 5 | Income index: (ln(GNI) – ln(100)) ÷ (ln(75,000) – ln(100)) | (ln(70,000) – ln(100)) ÷ (ln(75,000) – ln(100)) = 0.970 |
| 6 | HDI = (Health × Education × Income)^(1/3) | (0.962 × 0.949 × 0.970)^(1/3) = 0.960 |
Examples:
📍 Domestic Economy Example: The United States HDI is approximately 0.92-0.93. Health index is lower than peer countries (lower life expectancy). Education index is very high. Income index is very high (capped at $75,000, but US GNI per capita exceeds that).
📍 Global Example: Norway consistently ranks #1 or #2 on HDI (0.96+), with high scores on all three dimensions: life expectancy (82-83 years), education (excellent), and income (high, with low inequality).
👉 Compare countries by HDI. [Get global data visualization tools here] 🌍
HDI Categories and Classification
HDI Categories
| Category | HDI Range | Number of Countries (Approx.) | Examples |
|---|
| Very High Human Development | 0.800 – 1.000 | 60-70 | Norway, Switzerland, Ireland, Germany, Australia, US, UK, Japan, South Korea |
| High Human Development | 0.700 – 0.799 | 50-60 | China, Russia, Brazil, Turkey, Mexico, Thailand |
| Medium Human Development | 0.550 – 0.699 | 40-50 | India, Indonesia, Philippines, Egypt, Vietnam |
| Low Human Development | Below 0.550 | 30-40 | Afghanistan, Chad, Central African Republic, South Sudan |
Very High Human Development Countries (Top 10, Illustrative)
| Rank | Country | HDI (Approx.) | Life Expectancy | Mean Schooling | GNI per Capita (PPP) |
|---|
| 1 | Switzerland | 0.962 | 84 years | 13.9 years | $70,000+ |
| 2 | Norway | 0.961 | 83 years | 13.0 years | $70,000+ |
| 3 | Iceland | 0.959 | 83 years | 13.8 years | $55,000+ |
| 4 | Hong Kong | 0.956 | 85 years | 12.0 years | $60,000+ |
| 5 | Australia | 0.951 | 83 years | 12.7 years | $50,000+ |
| 6 | Denmark | 0.948 | 81 years | 13.0 years | $55,000+ |
| 7 | Sweden | 0.947 | 83 years | 12.6 years | $55,000+ |
| 8 | Ireland | 0.945 | 82 years | 12.7 years | $60,000+ |
| 9 | Germany | 0.942 | 81 years | 14.1 years | $55,000+ |
| 10 | Netherlands | 0.941 | 82 years | 12.7 years | $55,000+ |
Examples:
📍Domestic Economy Example: The United States ranks around #15-20 on HDI (0.92-0.93), behind many European countries, Canada, Australia, Japan, and South Korea. Despite having the highest GDP per capita among large countries, US health outcomes (life expectancy) drag down its HDI ranking.
📍 Global Example: China has moved from Low Human Development to High Human Development over the past 40 years. HDI rose from ~0.4 in 1980 to ~0.78 today, reflecting massive improvements in life expectancy, education, and income. This is the largest and fastest human development improvement in history.
👉 Invest in rising human development. [Explore emerging market investment platforms here] 📈
HDI Around the World (Regional Comparison)
HDI by Region (Average, Illustrative)
Surprising HDI Success Stories (Countries That Outperform Their GDP)
| Country | GDP per Capita (PPP) Rank | HDI Rank | Difference | Explanation |
|---|
| Costa Rica | ~60th | ~40th | +20 | Strong healthcare, education, peace (no military) |
| Sri Lanka | ~90th | ~70th | +20 | Strong healthcare, education (despite civil war) |
| Cuba | ~100th | ~70th | +30 | Very strong healthcare, education (despite poverty, dictatorship) |
| Vietnam | ~110th | ~85th | +25 | Strong education, health improvements |
| Georgia | ~100th | ~60th | +40 | Reforms after Soviet collapse |
Surprising HDI Underperformers (Countries That Underperform Their GDP)
| Country | GDP per Capita (PPP) Rank | HDI Rank | Difference | Explanation |
|---|
| United States | ~5th | ~15-20th | -10 to -15 | Poor health outcomes (life expectancy), inequality |
| South Africa | ~90th | ~110th | -20 | Extreme inequality, HIV/AIDS, violence |
| Botswana | ~80th | ~100th | -20 | HIV/AIDS (though improving) |
| Kuwait, Saudi Arabia, UAE | ~10-20th | ~30-40th | -20 | Oil wealth concentrated; health, education lag Western peers |
Examples:
📍 Domestic Economy Example: The United States is a major underperformer relative to its GDP. Despite having the world’s largest economy and highest GDP per capita among large countries, US HDI ranking (#15-20) lags behind many European countries, Canada, Australia, Japan, and South Korea. The main culprit: poor health outcomes (lower life expectancy, higher infant mortality, higher maternal mortality, more chronic disease).
📍 Global Example: Costa Rica is a major overperformer relative to its GDP. Despite modest income (GDP per capita ~$20,000), Costa Rica has life expectancy (80+ years) comparable to the US (despite spending much less on healthcare) and strong education outcomes. This reflects investment in primary care, education, and peace (Costa Rica abolished its military in 1949).
👉 Learn from HDI success stories. [Get public policy and development economics tools here] 📚
Limitations of HDI (What It Doesn’t Measure)
What HDI Misses
| Limitation | Explanation | Example |
|---|
| Inequality | HDI uses averages; doesn’t show gaps between rich and poor. | US HDI high but inequality high; Nordic countries high HDI and low inequality. |
| Inequality-adjusted HDI (IHDI) | UNDP publishes IHDI, which adjusts for inequality in health, education, and income. | US IHDI much lower than HDI (inequality penalty); Nordic IHDI close to HDI. |
| Gender inequality | HDI doesn’t directly measure gender gaps (though UNDP publishes Gender Development Index, GII). | Some countries with high HDI have large gender gaps (Japan, South Korea). |
| Poverty | HDI doesn’t directly measure poverty (though UNDP publishes Multidimensional Poverty Index, MPI). | A country can have high average HDI but significant poverty (US, UK). |
| Environmental sustainability | HDI doesn’t account for environmental damage. | High HDI countries often have high carbon footprints. |
| Political freedom, human rights | HDI doesn’t measure democracy, civil liberties, or political rights. | Cuba has high HDI (health, education) but no political freedom. |
| Safety, security | HDI doesn’t measure crime, violence, or war. | Some countries with decent HDI have high violence (Mexico, South Africa). |
| Happiness, well-being | HDI doesn’t measure subjective well-being (though World Happiness Report does). | Nordic countries rank #1 on happiness but not #1 on HDI. |
The Inequality-Adjusted HDI (IHDI)
| Country | HDI | IHDI | Loss (%) | Interpretation |
|---|
| Norway | 0.961 | 0.90+ | ~5% | Low inequality |
| Germany | 0.942 | 0.90+ | ~5% | Low inequality |
| United States | 0.921 | 0.80-0.82 | ~10-12% | High inequality penalty |
| South Africa | 0.70 | 0.45-0.50 | ~30% | Extreme inequality penalty |
Examples:
Domestic Economy Example: The United States has a large gap between HDI and IHDI (inequality-adjusted HDI). While US averages are high (life expectancy 76-78 years, high education, high income), these averages hide enormous disparities: rich Americans live 10-15 years longer than poor Americans; educational outcomes vary dramatically by wealth; income inequality is among the highest in the developed world.
📍 Global Example: South Africa has one of the largest gaps between HDI and IHDI. While average life expectancy is ~65 years, outcomes vary dramatically by race and wealth. The legacy of apartheid persists in extreme inequality.
👉 Invest in reducing inequality. [Explore impact investing and community development platforms here] 🤝
How HDI Affects the Domestic and Global Economy
Macroeconomic Implications
| High HDI | Low HDI |
|---|
| Higher productivity (educated, healthy workforce). | Lower productivity (poor health, low education). |
| Stronger institutions, rule of law. | Weak institutions, corruption, conflict. |
| More innovation, R&D, technology adoption. | Low innovation; technology adoption slow. |
| Higher social trust, lower crime, political stability. | Low trust, high crime, political instability. |
| Attracts FDI, skilled immigration. | Repels FDI; brain drain (skilled leave). |
The HDI-Growth Connection
| Relationship | Explanation |
|---|
| HDI drives growth | Educated, healthy workers are more productive → higher GDP growth. |
| Growth drives HDI | Higher incomes allow investment in health, education, infrastructure. |
| Virtuous cycle | High HDI → growth → higher HDI (if growth shared). |
| Vicious cycle | Low HDI → low growth → lower HDI (poverty trap). |
Examples:
📍 Domestic Economy Example: The United States has high HDI and high GDP, but health outcomes drag down HDI relative to peers. Investing in universal healthcare, preventive care, and social determinants of health could boost US HDI (and potentially productivity, growth).
📍 Global Example: China achieved rapid HDI improvement (low → high) alongside rapid GDP growth. Investment in education, healthcare, and infrastructure drove both HDI and growth. This virtuous cycle lifted hundreds of millions out of poverty.
👉 Invest in countries with improving HDI. [Get emerging market and development investment tools here] 📈
How HDI Affects Your Money 💰
Direct and Indirect Impacts
| HDI Level | Impact on You |
|---|
| Very High HDI (Nordics, Germany, Australia) | • Higher productivity → higher wages • Better public services (healthcare, education, infrastructure) • Higher taxes (funding services) • Lower crime, higher trust • Political stability |
| High HDI (US, UK, France, Japan) | • Mixed: high wages (US) but poor health; lower taxes (US) but fewer services • Inequality can be high (US, UK) • Political polarization (US, UK) |
| Medium/Low HDI (India, Vietnam, Nigeria) | • Lower wages (for most) • Poorer public services (if you’re poor; expats can access private) • Higher growth potential (catch-up growth) • Higher risk (political instability, corruption, crime) |
HDI and Investment Opportunities
| Investment Type | High HDI Countries | Low/Medium HDI Countries |
|---|
| Public equities | Stable returns, lower growth | Higher potential growth, higher risk |
| Bonds | Lower yields (safe havens) | Higher yields (risk premium) |
| Real estate | Stable appreciation | Higher potential appreciation (urbanization) |
| Private equity / venture capital | Mature ecosystems | High-growth startups (tech, fintech) |
| Infrastructure | Replacement/maintenance | New construction (catch-up growth) |
Examples:
📍 Domestic Economy Example: In the United States (Very High HDI), investors can expect stable but moderate returns. The economy is mature; growth is 2-3% annually. Safe but not spectacular. Real estate in top cities (NY, SF, LA) is expensive but stable.
📍 Global Example: In Vietnam (Medium HDI, rapidly improving), investors have seen rapid growth (5-7% annually) as the country converges toward higher HDI. Manufacturing FDI, real estate, and the stock market have boomed. Higher risk (political, regulatory) but higher potential returns.
👉 Balance your portfolio across HDI levels. [Get global asset allocation and diversification tools here] 🌍
Summary: Human Development Index (HDI)
| Sub-Segment | Key Takeaway |
|---|
| 3.15.1 What Is HDI? | Composite measure of health (life expectancy), education (years of schooling), and standard of living (GNI per capita). |
| 3.15.2 Three Dimensions | Health, Education, Income — each equally weighted. |
| 3.15.3 How HDI Is Calculated | Geometric mean of three dimension indices (0-1 scale). |
| 3.15.4 HDI Categories | Very High (0.8+), High (0.7-0.799), Medium (0.55-0.699), Low (<0.55). |
| 3.15.5 HDI Around the World | Nordics, Switzerland, Australia top; US #15-20; China rapid rise; Sub-Saharan Africa low. |
| 3.15.6 Limitations | Ignores inequality, gender, poverty, environment, political freedom. IHDI adjusts for inequality. |
| 3.15.7 How HDI Affects Economy | High HDI → higher productivity, innovation, stability, attracts FDI. |
| 3.15.8 How HDI Affects Your Money | Very High HDI: stable returns, high taxes, good services. Rising HDI: higher growth potential, higher risk. |
🌟 Final Thoughts on the Human Development Index (HDI)
Understanding the economy requires looking beyond GDP to ask: are people living longer, learning more, and earning enough? HDI answers that question.
| Do This | Don’t Do This |
|---|
| ✅ Use HDI as a broader measure of progress beyond GDP. | ❌ Assume GDP alone determines quality of life (Costa Rica outperforms; US underperforms). |
| ✅ Look at IHDI (inequality-adjusted HDI) to see how evenly progress is shared. | ❌ Ignore what HDI misses: inequality, gender gaps, environment, political freedom. |
| ✅ Compare HDI across countries to understand true development. | ❌ Believe that high HDI is only for rich countries (Costa Rica, Cuba, Sri Lanka show otherwise). |
| ✅ Invest in countries with rapidly rising HDI (catch-up growth potential). | ❌ Forget that health and education are investments, not just consumption. |
HDI reminds us that economic growth is a means, not an end. The ultimate goal of the domestic and global economy is not to maximize GDP but to enable people to live long, educated, and prosperous lives. By understanding HDI, you can make better decisions as a voter, an investor, and a global citizen.
👉 Invest in human development. [Start with ESG, impact investing, and global development tools here] 🌟
❓ Frequently Asked Questions (FAQs) – Human Development Index (HDI)